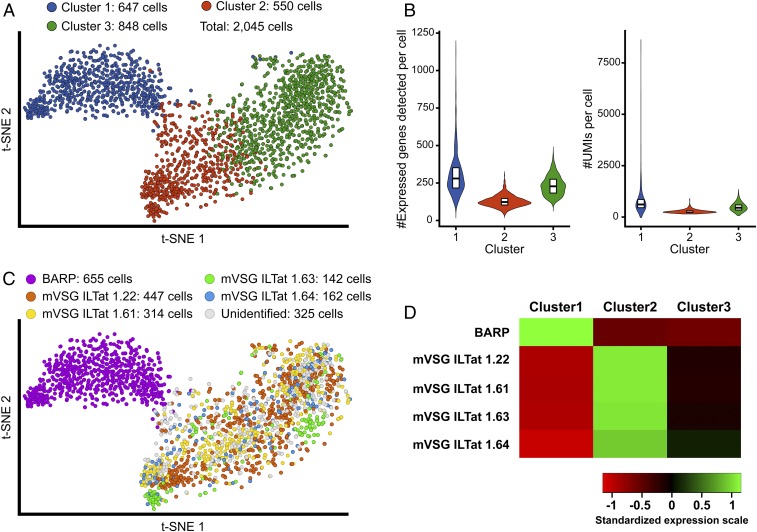
Fig. 1.
Clustering of SG-associated parasites based on scRNA-seq profiles. Clusters were determined using the Euclidean metric after determining the optimal number of clusters using the K-means method. Parasite cells were grouped in three clusters (K = 3) including 647 cells (cluster 1, blue), 550 cells (cluster 2, red), and 848 cells (cluster 3, green). (A) T-distributed stochastic neighbor embedding (t-SNE) plot of the 2,045 single-sequenced parasite cells. Colors indicate associated clusters. (B) Violin plots of the number of expressed genes detected per cell for each cluster (Left). Violin plots of the number of UMI counts per cell for each cluster (Right). Boxes represent the median and the first and third quartiles. (C) t-SNE plot of the 2,045 single parasite cells. Color indicates the main coat protein expressed by a given cell. Sequencing data for each individual BARP-coding gene were merged to represent the sequencing of one global coding gene: 655, 447, 314, 142, and 162 cells expressing BARP (pink), VSG ILTat 1.22 (orange), VSG ILTat 1.61 (yellow), VSG ILTat 1.63 (green), and VSG ILTat 1.64 (blue) as their main coat protein, respectively. A total of 325 cells were expressing neither BARP nor an identified VSG (gray). (D) Heatmaps of the averaged and standardized LSM expression value of the genes coding for the coat proteins in the three parasite cell clusters.

