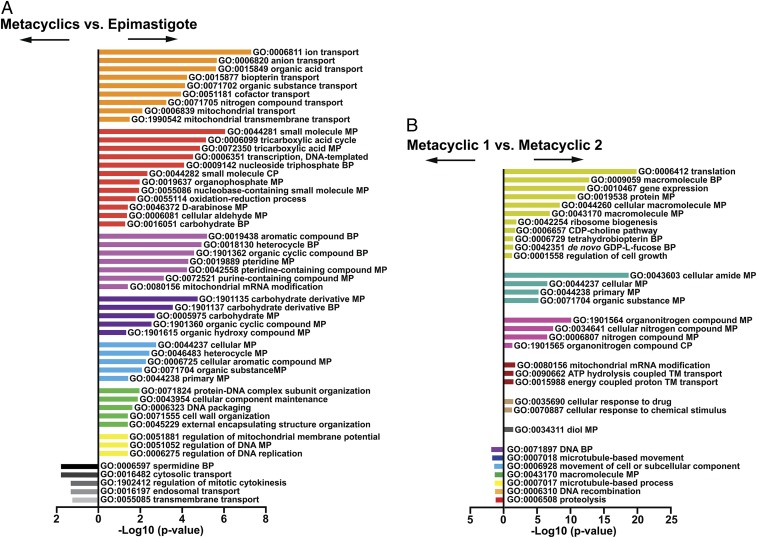
Fig. 2.
GO enrichment analysis of epimastigote and metacylic forms. (A) Biological process-associated GO terms significantly enriched in epimastigote forms (Right bars) in comparison to metacyclic forms (Left bars). (B) Biological process-associated GO terms significantly enriched in cells in Meta1 cluster (Right bars) in comparison to parasites in Meta2 (Left bars). In both comparisons, the GO terms have been filtered using the REVIGO webtool to avoid redundancies. Bars represent the level of significance of the term enrichment. Bars of the same colors represent terms that are closely associated.

