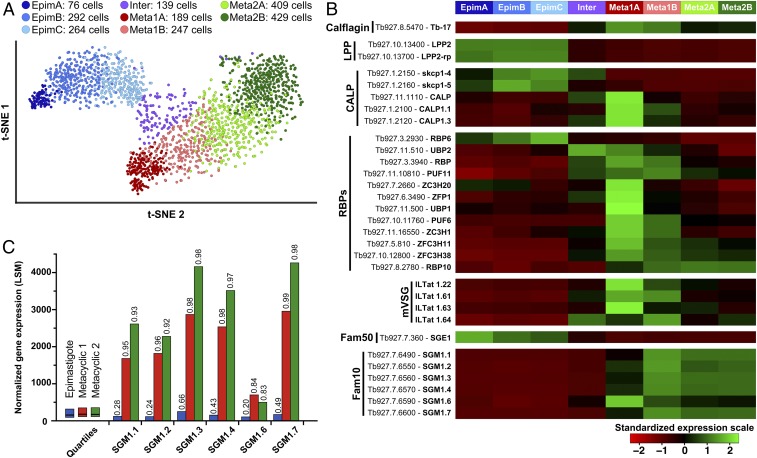
Fig. 3.
Cluster-specific gene expression profiles. Parasite cells within the clusters Epim, Meta1, and Meta2 were further divided into eight subclusters. Epim includes 76, 292, and 277 cells clustered as EpimA (dark blue), EpimB (blue), and EpimC (light blue), respectively. Meta1 includes 189 and 223 cells clustered as Meta1A (dark red) and Meta1B (light red), respectively. Meta2 includes 433 and 433 cells clustered as Meta2A (dark green) and Meta2B (light green), respectively. A total of 122 cells located at the intersection of clusters Epim, Meta1, and Meta2 were clustered as an intermediary cluster (Inter, violet). (A) t-SNE plot of the 2,045 single-sequenced parasite cells. Colors indicate associated cluster. (B) Heatmaps of the averaged and standardized LSM expression value of genes encoding LPPs, CALPs, RBPs, the four prominent mVSGs, SGE1 proteins in Fam50, and SGM1 proteins in Fam10 in the eight subclusters. Sequencing data for the five individual SGE-coding gene were merged to represent the sequencing of one global coding gene. ZC3Hx, zinc-finger proteins; PUF, pumilio family RBP; SGM, salivary gland metacyclic protein. (C) LSM of the Fam10 member gene expression values in clusters Epim (blue), Meta1 (red), and Meta2 (green). For each cluster, the first, second (median), and third quartiles are represented as a point of comparison. Percentiles of genes that are less expressed than the represented gene are given on top of the bars.

