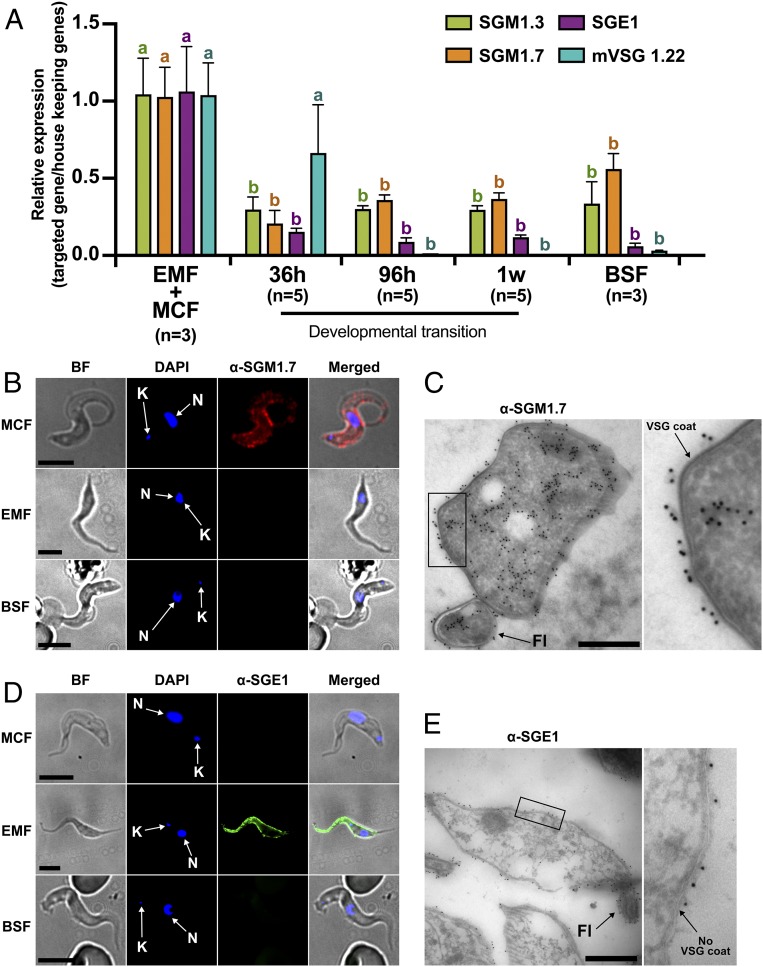
Fig. 4.
Expression and cellular localization of SGM1.7 and SGE1. (A) qRT-PCR analysis of sgm1.3, sgm1.7, sge1, and mVSG1.22 expression in infected SG and in mice blood purified temporally postchallenge with SG purified parasites. Data were normalized using the geometrical mean of the expression of DNA ligase I, AATP5, and PM20. EMF, epimastigote form; MCF, metacyclic form; BSF, bloodstream form. Statistical analysis was conducted using a one-way ANOVA followed by Tukey’s HSD post hoc test for pairwise comparisons. For each gene, statistical significance is represented by letters above each condition, with different letters indicating distinct statistical groups (P < 0.05). Complete statistical results are available in Dataset S4. (B) Immunofluorescence assay of SGM1.7. Red, anti-rSGM1.7; blue, DAPI. BF, bright field; N, nucleus; K, kinetoplast. (Scale bars: 5 µm.) (C) Immunogold staining for localization of SGM1.7. Black dots represent 10 nm colloidal gold-labeled protein A binding to antibodies specific for SGM1.7. Right is a magnification of the Left black frame. Fl, flagellum. (Scale bar: 500 nm.) (D) Immunofluorescence assay of SGE1. Red, anti-rSGE1; blue, DAPI. N, nucleus; K, kinetoplast. (Scale bars: 5 µm.) (E) Immunogold staining for localization of SGE1. Black dots represent 10 nm colloidal gold particles labeled protein A binding to antibodies specific for SGE1. Right is a magnification of the Left black frame. Fl, flagellum. (Scale bar: 500 nm.)

