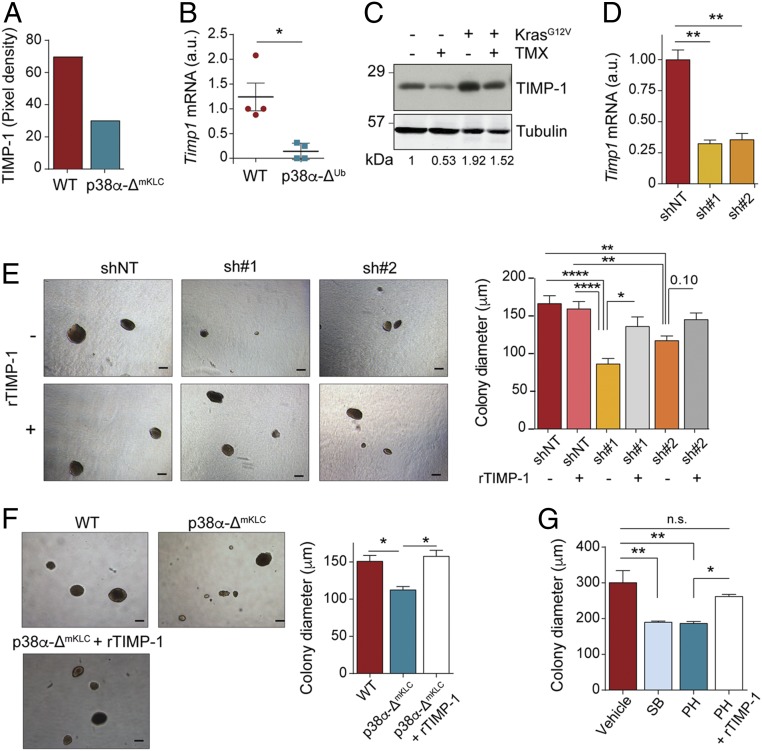
Fig. 6.
p38α-regulated expression of TIMP-1 induces lung cancer cell proliferation. (A) Relative TIMP-1 protein levels in lung tumors from mice that were intratracheally inoculated with either WT or p38α-ΔmKLC cells, as determined using a cytokine array (n = 20 tumors from 4 mice per condition analyzed in a single array). (B) Relative Timp1 mRNA expression in tumors from WT and p38α-ΔUb mice (n = 4 tumors from ≥3 mice per group). (C) Representative immunoblots with antibodies to TIMP-1 and tubulin as a loading control of whole lung lysates from WT and p38α-ΔUb mice, as indicated by − and + tamoxifen (TMX), respectively, either expressing or not expressing the KrasG12V oncogene. Each line corresponds to one mouse. (D) Histogram showing Timp1 down-regulation in WT mKLC cells treated with shRNAs targeting Timp1 (sh#1 and sh#2) or a nontargeting control (shNT). (E) Representative images of the soft agar colonies formed by WT mKLC cells treated as in D in the presence or absence of recombinant TIMP-1 protein (rTIMP-1; 0.1 μg/mL) added twice per week. (Scale bars, 150 μm.) The histogram shows the average colony diameters (n ≥ 52 colonies analyzed per group from 3 replicates). (F) Representative images of the soft agar colonies formed by WT cells, p38α-ΔmKLC cells, and p38α-ΔmKLC cells treated with rTIMP-1 protein (0.1 μg/mL) twice per week. (Scale bars, 150 μm.) The histogram shows the average colony diameters (n ≥ 144 colonies analyzed per group from 6 replicates). (G) Average diameters of the colonies formed by the human NSCLC cell line H460 grown in soft agar for 20 d and treated with vehicle, the p38α inhibitors SB203580 (SB) and PH797804 (PH), or PH plus 0.1 μg/mL rTIMP-1 protein (≥119 colonies analyzed per group from 3 replicates). Data represent mean ± SEM. *P < 0.05, **P < 0.01, ****P < 0.0001. n.s., not significant.

