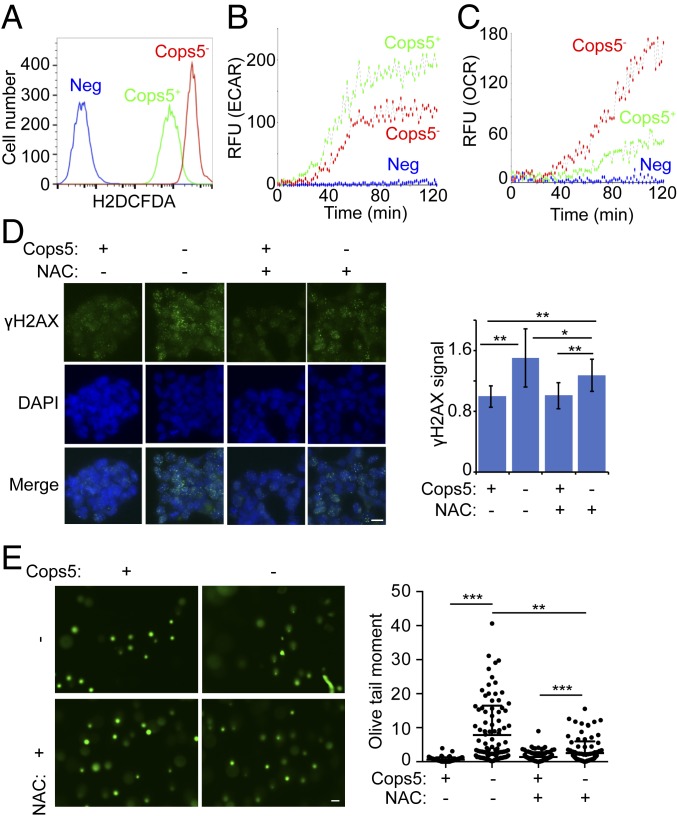
Fig. 5.
Cops5 KO alters cellular metabolism and elevates ROS level. (A) Measurement of ROS in iC5; C5 KO ESCs cultured with or without Dox for 48 h. (B) Extracellular acidification rate (ECAR) of iC5; C5 KO ESCs with or without Dox for 48 h. (C) Oxygen consumption rate (OCR) of iC5; C5 KO ESCs with or without Dox for 48 h. (D) iC5; C5 KO ESCs were cultured with or without Dox for 48 h. For the NAC treatment group, 3 mM NAC was added during the 48 h. Representative immunofluorescence images of γH2AX (three independent experiments) are shown on the Left. (Scale bar, 10 μm.) Relative fluorescence intensities of γH2AX were quantified in ∼100 nuclei for each condition and plotted (Right). (E) Comet assay of iC5; C5 KO ESCs treated as D. (Left) The representative images. (Scale bar, 50 μm.) Comet tail lengths of 100 cells per sample are quantified (Right). *P < 0.05; **P < 0.01; ***P < 0.001.

