Fig. 6.
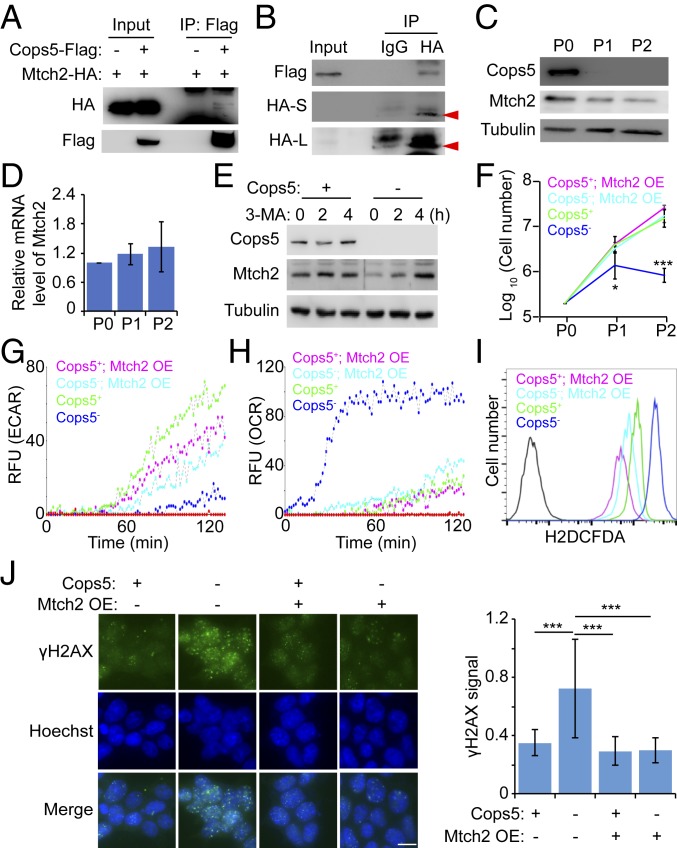
Cops5 regulates cellular metabolism through Mtch2. (A and B) The co-IP experiment to detect the interaction between Cops5 and Mtch2. (A) ESCs with or without stable Cops5-Flag expression were transfected with Mtch2-HA–expressing plasmid. Forty-eight hours after transfection, cells were harvested for the co-IP experiment using anti-Flag M2 magnetic beads. (B) Cell extracts from ESCs stably expressing Cops5-Flag and Mtch2-HA were used for the co-IP experiment, using IgG or anti-HA antibody, together with protein G beads. (C and D) Mtch2 protein (C) and mRNA (D) levels in iC5; C5 KO ESCs at various time points after Dox withdrawal. (E) iC5; C5 KO ESCs were cultured with or without Dox for 48 h and then treated with 5 mM 3-MA for the indicated time. Mtch2 protein levels in these cells were detected by Western blot. (F) Mtch2 overexpression rescues the growth defect of Cops5 KO ESCs. iC5; C5 KO and iC5; C5 KO; Mtch2 OE ESCs were cultured with or without Dox for two passages. Cell numbers were counted for every passage, and an equal amount of ESCs was plated onto tissue culture dishes. (G) ECAR of iC5; C5 KO and iC5; C5 KO; Mtch2 OE ESCs with or without Dox for 48 h. (H) OCR of iC5; C5 KO and iC5; C5 KO; Mtch2 OE ESCs with or without Dox for 48 h. (I) Measurement of ROS in iC5; C5 KO and iC5; C5 KO; Mtch2 OE ESCs with or without Dox for 48 h. (J) Immunofluorescence images of γH2AX in iC5; C5 KO and iC5; C5 KO; Mtch2 OE ESCs with or without Dox for 48 h. (Left) Representative immunofluorescence images of three independent experiments. Relative fluorescence intensities of γH2AX were quantified in ∼100 nuclei for each condition and plotted (Right). (Scale bar, 10 μm.) *P < 0.05; ***P < 0.001.

