Fig. 1.
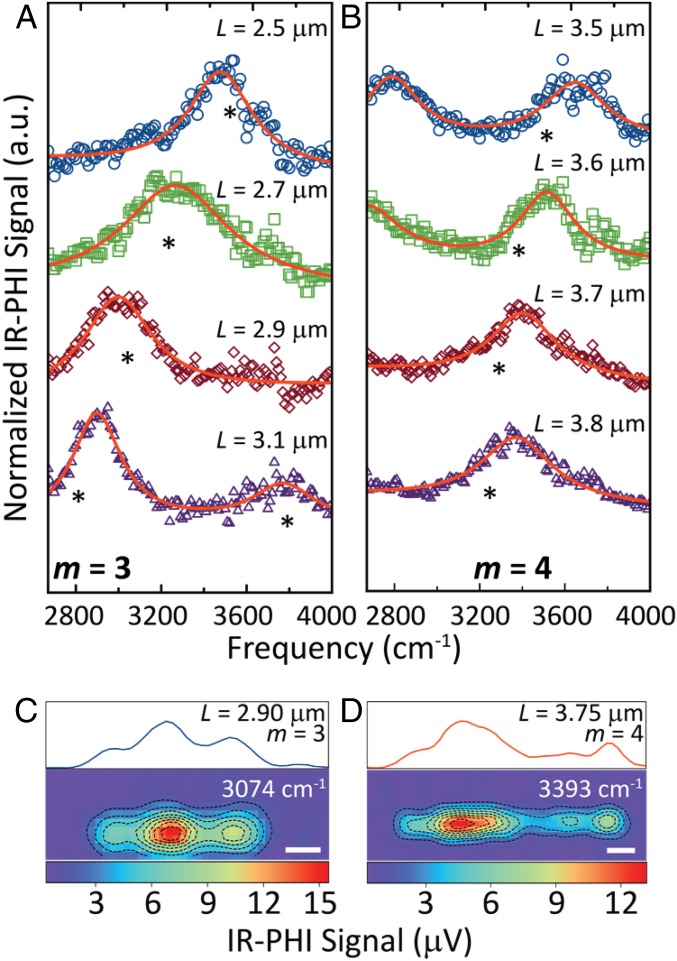
(A and B) IR-PHI spectra of individual Au NWs with lengths L = 2.50–3.80 μm. Asterisks denote positions of the (A) m = 3 and (B) m = 4 resonances from Eq. 1. Solid red lines are Lorentzian fits to the data. (C and D) False-color IR absorption maps obtained at 3,074 and 3,393 cm−1 for Au NWs with lengths of L = 2.90 and 3.75 μm, respectively. Averaged line profiles are presented above each IR absorption map. (Scale bars, 0.5 μm.)

