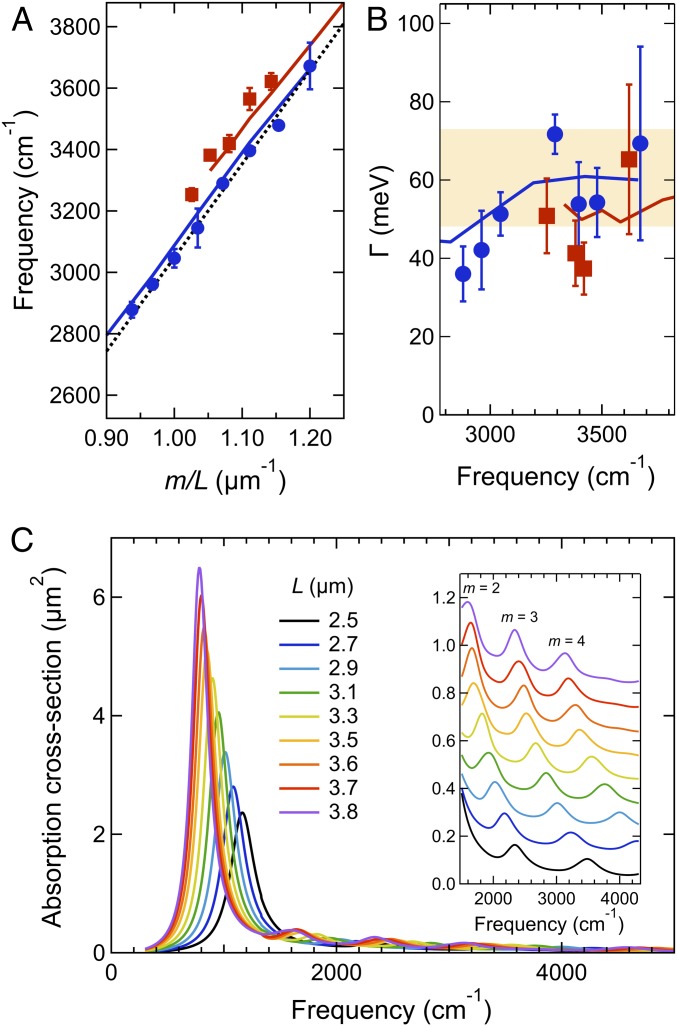
Fig. 2.
(A) Resonance frequencies as a function of inverse length times mode order and (B) average linewidths versus frequency for the m = 3 (blue circles) and m = 4 (red squares) Fabry–Pérot resonances of the gold NWs. Data collected from at least three NWs with error bars representing SDs. The dashed black line in A shows the frequencies calculated from Eq. 1. The shaded area in B shows the range of values for the Drude relaxation parameter for Au (55, 56). The solid red and blue lines in A and B are the results from the 3D FEM simulations. (C) Spectra for different length NWs calculated from FEM simulations. The lowest-frequency features are the m = 1 Fabry–Pérot resonances. (Inset) An expanded view of the higher-energy m = 2, 3, and 4 resonances (the spectra have been offset for clarity).

