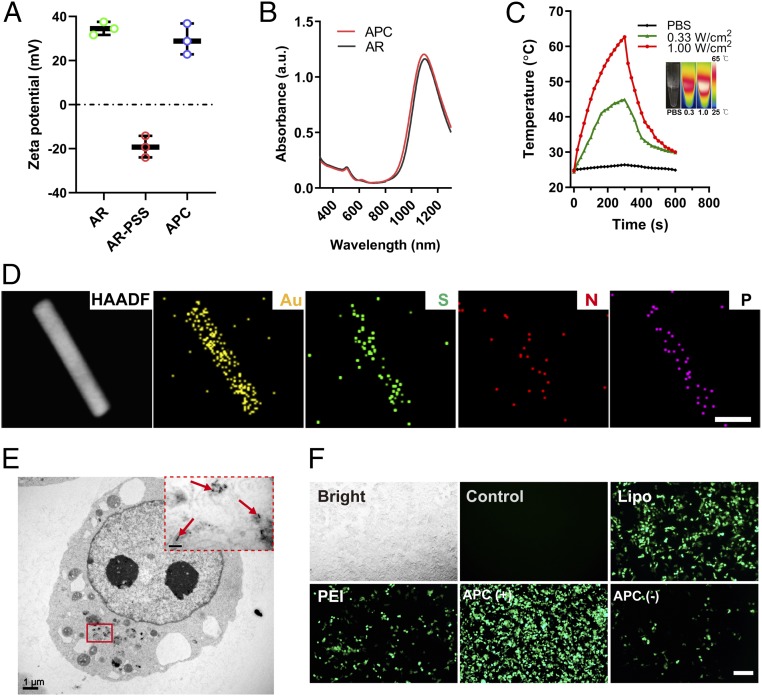
Fig. 2.
Characterization of APC and evaluation of transfection activity. (A) Zeta-potential analysis of Au nanorods, PSS-coated AR, and APC. Mean ± SD; n = 3. (B) Absorption spectrum of AR and APC. (C) Solution temperature of APC as a function of laser irradiation time. The laser wavelength was 1,064 nm. (C, Inset) Thermal image of a PBS solution at a laser power density of 0.33 W/cm2 (Left) and APC solution at a power density of 0.33 W/cm2 (Middle) and 1.00 W/cm2 (Right) at their respective maximum temperatures. (D) HAADF-STEM and EDS mapping of APC–HSP-Cas9. (Scale bar, 25 nm.) (E) Bio-TEM image of 293T cells after the transfection of APC–HSP-Cas9 complexes. The arrows show the presence of APC in the cytoplasm. (F) GFP expression mediated by APC–HSP-Cas9 with (+) or without (−) laser irradiation at 1,064 nm. Lipo- and PEI-mediated transfections at 42 °C were used as positive controls, whereas cells without any treatment were used as a negative control. (Scale bar, 200 µm.)

