Fig. 3.
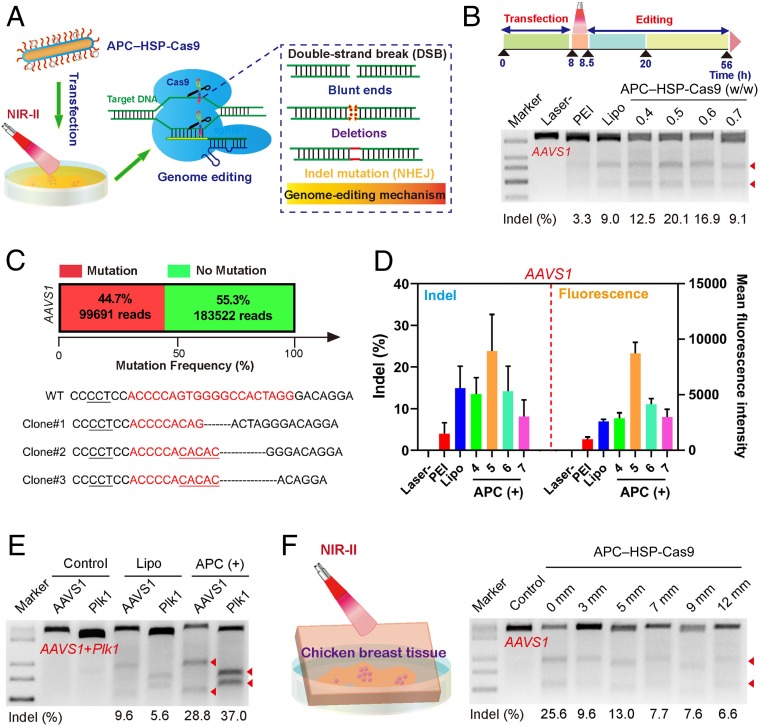
Optogenetic activation of CRISPR-Cas9 genome editing by APC–HSP-Cas9. (A) Illustration of optogenetic activation mediated by APC. (B) Indel mutations of the AAVS1 locus of 293T cells transfected with APC–HSP-Cas9 complexes with or without laser irradiation. APC was complexed with HSP-Cas9 at different weight ratios. Lipo and PEI were used as positive controls. (C) Deep-sequencing analysis of mutation frequency at the AAVS1 locus (optimal weight ratio of 0.5) and Sanger sequencing results of T–A cloning from 293T cells (AAVS1) after APC-mediated transfection, followed by optogenetic activation. The target sequences are marked in red. The PAM is underlined (black). Substitutions, insertions, and deletions are marked by red base sequences, underlining (red), and dotted lines, respectively. A library of genomic DNA pooled from the sample in triplicate was subjected to deep-sequencing analysis. (D) Analysis of indel rate, as revealed by the grayscale density of cut bands from T7E1 results, after the transfection of APC–HSP-Cas9 targeting AAVS1 with or without laser treatment (Left). The corresponding GFP expression was evaluated; 4, 5, 6, and 7 refer to APC/HSP-Cas9 weight ratios 0.4, 0.5, 0.6, and 0.7, respectively. Mean ± SD; n = 3. (E) Indel mutation from multiplex genome editing by HSP-Cas9 targeting Plk1 and AAVS1 with laser irradiation. (F) Illustration of cultured cells exposed to irradiation in the presence of a piece of chicken breast tissue (Left). Indel mutations of the AAVS1 locus from 293T cells transfected with APC–HSP-Cas9, followed by irradiation in the presence of breast chicken tissue of different thicknesses (Right). The arrowheads in B, E, and F show the cleaved DNA fragments of the target genome.

