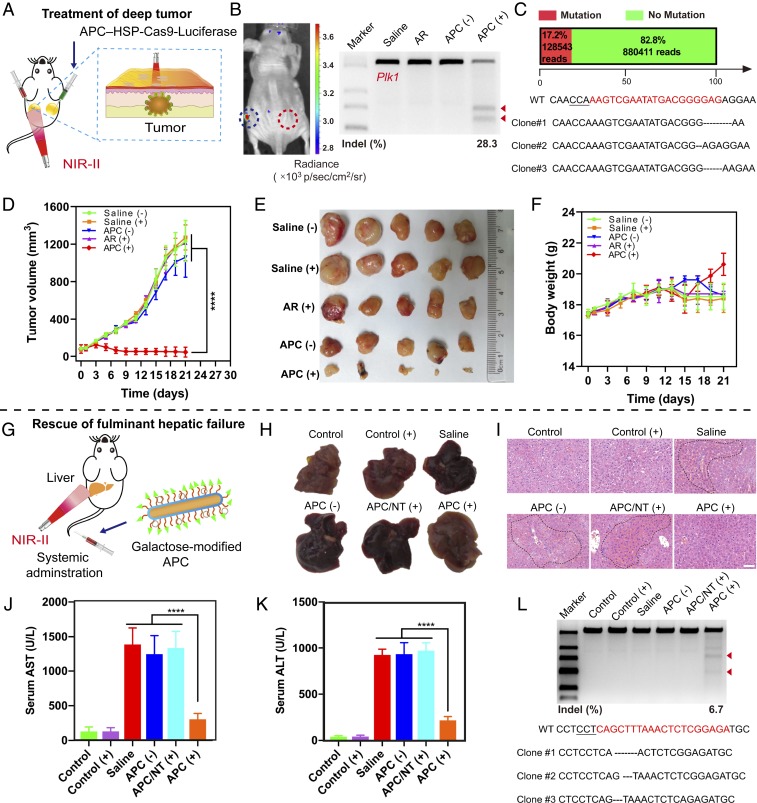
Fig. 6.
APC-mediated optogenetic activation for therapeutic genome editing in vivo. (A) Illustration of optogenetic activation for in vivo cancer therapy. APC–HSP-Cas9 complexes were administered through peritumoral injection, followed by the exposure of the tumor to irradiation. (B) In vivo luciferase expression in the tumor tissue. The left tumor was exposed to laser irradiation, and the right one, without laser exposure, was used as the control. T7E1 assay of indel mutations of Plk1 in the tumor tissue. (C) Analysis of in vivo Plk1 gene mutation efficiency through deep sequencing and Sanger sequencing. The mutation frequency was determined from a single deep-sequencing library prepared from genomic DNA pooled from five mice. (D) Tumor growth curve after the transfection of APC–HSP-Cas9 complexes in the tumor tissue, followed by exposure to irradiation. The treatment was carried out twice a week, and continued for 3 wk. Mean ± SD; n = 5 (two-way ANOVA with a Bonferroni post hoc test, ****P < 0.0001). (E) Images of dissected tumor tissues from tumor-bearing BALB/c mice with different treatments. (F) The body-weight change during the treatment. (G) Illustration of optogenetic activation of nanoCRISPR in vivo to rescue mice from fulminant hepatic failure. Mice were injected intravenous through the tail vein with APC–HSP-Cas9–Fas complexes, followed by irradiation over the liver position. (H) Images of dissected livers from mice with fulminant hepatic failure. (I) H&E staining of liver slices from mice 10 d after the treatment. The regions in the dotted lines denote accumulation of blood cells. (Scale bar, 50 µm.) (J and K) Serum AST and ALT from a mouse injected with saline, APC–HSP-Cas9-NT with irradiation (NT, nontargeted scramble sgRNA), and APC–HSP-Cas9–Fas (with or without irradiation) 10 d after treatment. Mean ± SD; n = 4 (one-way ANOVA with a Tukey post hoc test, ****P < 0.0001). (L) Indel mutation analysis of the Fas gene by T7E1 assay and mutation Sanger sequencing after the optogenetic activation of nanoCRISPR in the liver of mice with fulminant hepatic failure. The arrowheads in B and L show the cleaved DNA fragments of the target genome.

