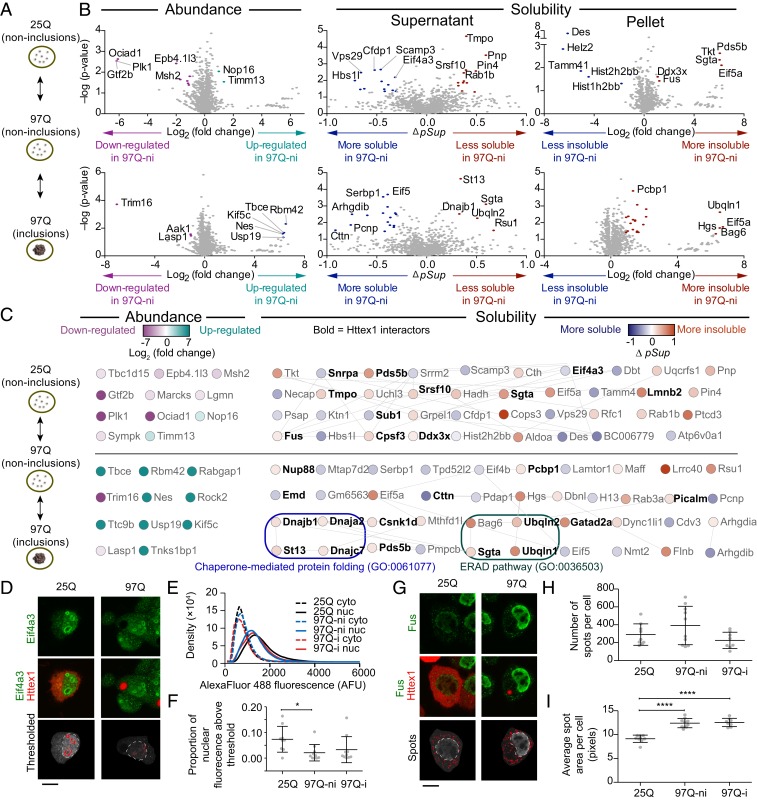
Fig. 2.
Impact of a Httex1 mutation and subsequent aggregation on solubility of endogenous proteins. (A) Neuro2a cells transiently expressing Httex1-GFP for wild-type polyQ (25Q) and mutant polyQ (97Q) were presorted into three groups by PulSA with matched expression levels as shown. ni denotes cells without inclusions, and i denotes cells with inclusions (B) Volcano plots of protein abundances and solubility, aligned to the schematic in A. Gray-colored points indicate proteins below the threshold of significance (twofold change and P value of 0.05 for abundance and Δ pSup value of 0.3, Pellet ratio log2 value of 1 and P value of 0.05). (C) Protein networks represented by STRING (v.11.0) analysis with medium confidence interactions. Selected significantly enriched gene ontology (GO) terms are annotated. All enriched GO terms are included in Dataset S2. (D) Confocal micrographs of Neuro2a cells transfected with Httex1-mCherry and immunostained with Eif4a3. Thresholds for nuclear ring structures (red pattern) and nucleus boundary (white dashed lines) are shown. (E) Histograms of Eif4a3 immunofluorescence intensity inside the nucleus and in the cytoplasm (at least, nine cells were analyzed for each histogram). (F) Proportion of nuclear Eif4a3 immunofluorescence above a defined brightness threshold that corresponds to the ring structures. (G) Confocal micrographs of Neuro2a cells transfected with Httex1-mCherry and immunostained with Fus. Thresholds annotated as described for D. (H) Number of spots per cell. (I) Average size of spots per cell. Data in F, H, and I all show datapoints as values from individual cells and with means ± SD shown. These panels also show results of one-way ANOVA and Tukey’s multiple comparisons test. *P < 0.05 and ****P < 0.0001. (Scale bars, 10 μm.)

