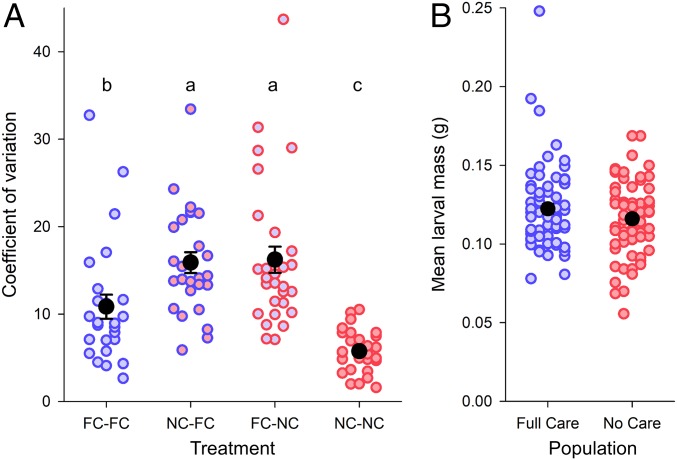
Fig. 4.
(A) The CV in the larval mass of individuals on a carcass in each of four treatments where focal and sibling larvae were derived from the different experimental evolution populations. Brood size was experimentally standardized to 10 larvae. The color of the circle outline depicts the populations from which the sibling larvae originated (blue circle outlines are for FC larvae; red circle outlines are for NC larvae). Fill color denotes the populations from which the focal were drawn (blue fill is for FC larvae; red fill is for NC larvae). Solid black circles indicate the overall mean for each treatment, and bars are ±1 SE. Treatment labels (e.g., FC−FC) refer to the population from which the focal larvae were drawn and the sibling larvae were drawn. Treatments not sharing a letter are significantly different in post hoc comparisons (P < 0.05). (B) Larval mass attained by the experimentally evolved populations at generation 23 when reared under their usual environmental conditions (FC, parents present; NC, parents absent), and in brood sizes chosen by parents. Each blue or red datapoint represents the mean larval mass for one brood, whereas solid black circles denote the overall mean with bars ±1 SE.

