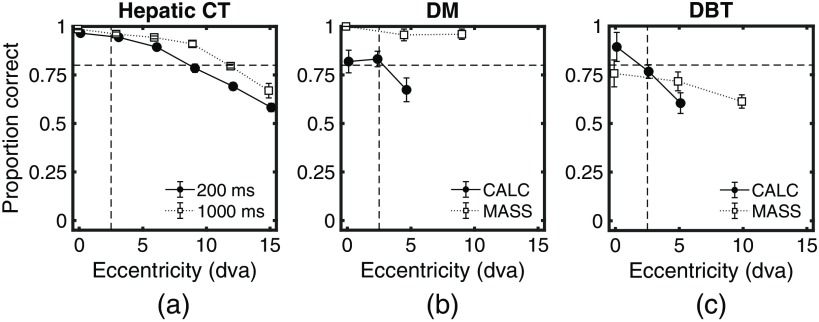
Fig. 2.
PC detecting the signal for the three different experiments. (a) Hepatic CT for presentation times of 200 and 1000 ms. (b) DM for a presentation time of 500 ms for calcification clusters (CALC) and masses (MASS). (c) DBT for a presentation time of 500 ms for CALC and MASS. Vertical and horizontal dashed lines at 2.5 deg and 0.8 PC were drawn as a reference for the currently accepted UFOV radius and its expected PC. Error bars are the standard error of the mean across observers.

