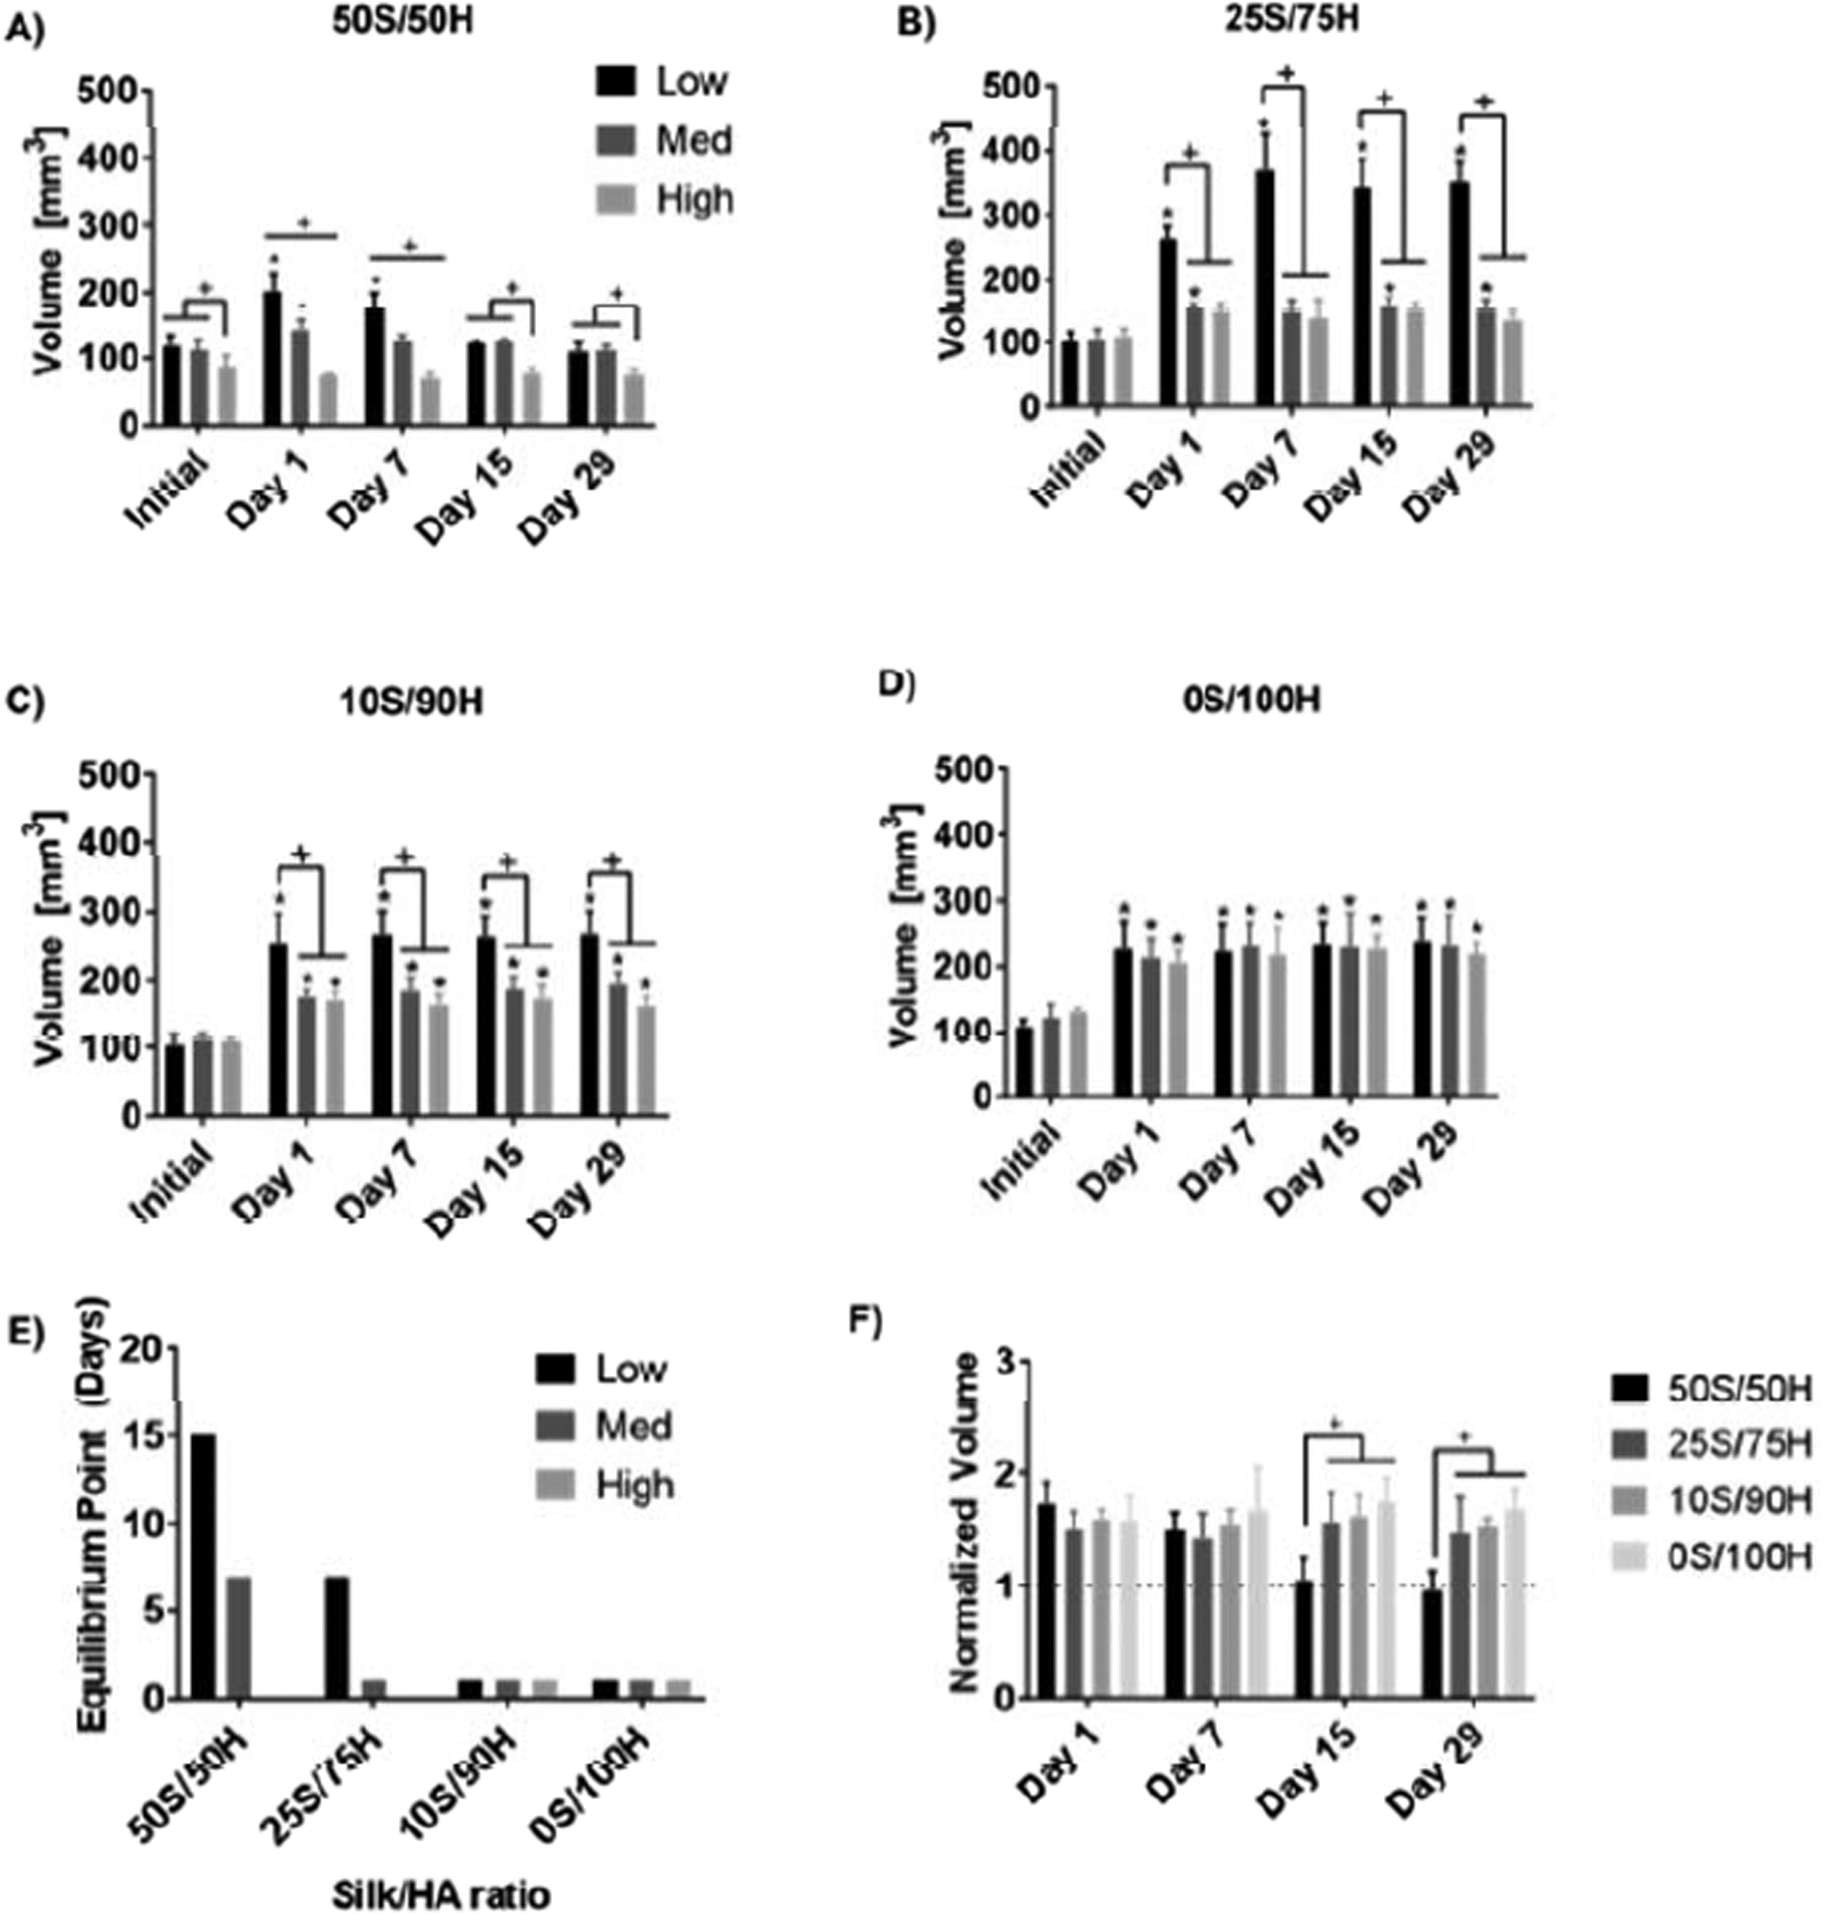
Figure 4. Swelling.

Volumes are reported for hydrogels over a 1-month period (A-D). The time at which the volume no longer changes is shown in (E) where hydrogels with increased HA concentration and higher H2O2 concentration equilibrated faster. When comparing between ratios of the same H2O2 concentration (F), the 50S/50H hydrogels had a lower normalized volume than all other ratios (+p≤0.05, *p≤0.05 compared to initial volume, n=5).
