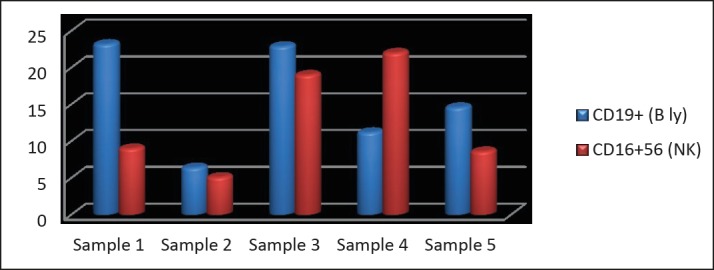
Figure 2. 10 samples of SLE patients. This diagram shows that samples 2, 5, 9 and 10 have seriously decreased number of CD16+56 cells while samples 7, 8, 9, and 10 have seriously increased number of CD19+ B cells. From these results we can conclude that the worst results had samples 9 and 10.

