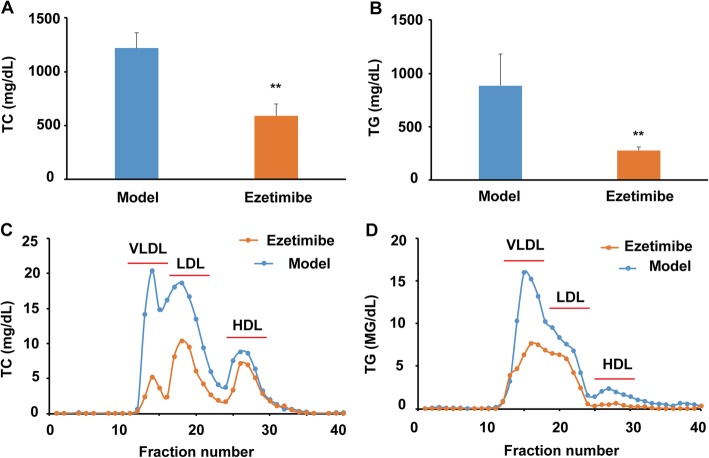
Fig. 1.
Effect of ezetimibe on the plasma profile of the LDLR−/− hamsters fed a high-fat diet (n = 5). a, ezetimibe lowers plasma TC of the LDLR−/− hamsters; b, ezetimibe lowers plasma TG of the LDLR−/− hamsters; c, TC profiles in different lipoprotein fractions after ÄKTA-FPLC separation; d, TG profiles in different lipoprotein fractions after ÄKTA-FPLC separation. Data are expressed as mean ± SD. **p < 0.01 vs model group

