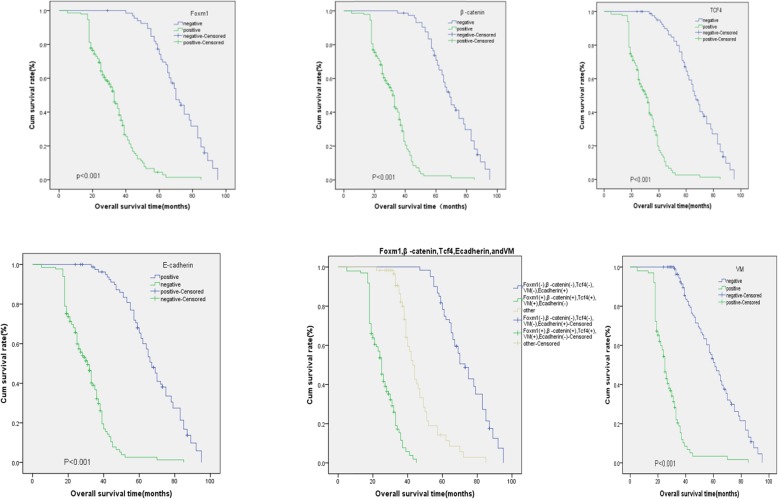
Fig. 3.
Kaplan-Meier analysis of the survival rates of patients with ESCC. a Overall survival of patients in relation to FoxM1 expression (log-rank =121.530, P < 0.001). b Overall survival of all patients in relation to β-catenin (log-rank = 132.879, P < 0.001). c Overall survival of patients in relation to TCF4 (log-rank = 129.901, P < 0.001), d Overall survival of patients in relation to VM expression (log-rank = 148.841, P < 0.001). e Overall survival of patients in relation to E-cadherin (log-rank = 69.208, P < 0.001). In (a-e), blue lines represents FoxM1 positive, or β-catenin, TCF4 or VM negative E-cadherin group; green lines: FoxM1 negative, or β-catenin, TCF4 or VM positive E-cadherin group. f Overall survival of all patients in relation to FoxM1, β-catenin, TCF4, VM and E-cadherin expression (log-rank = 220.469, P < 0.001). Blue lines: patients with negative E-cadherin and positive FoxM1, β-catenin, TCF4, VM expression; green line: patients with positive E-cadherin and negative FoxM1, β-catenin, TCF4, VM; brown line: other positive or negative proteins

