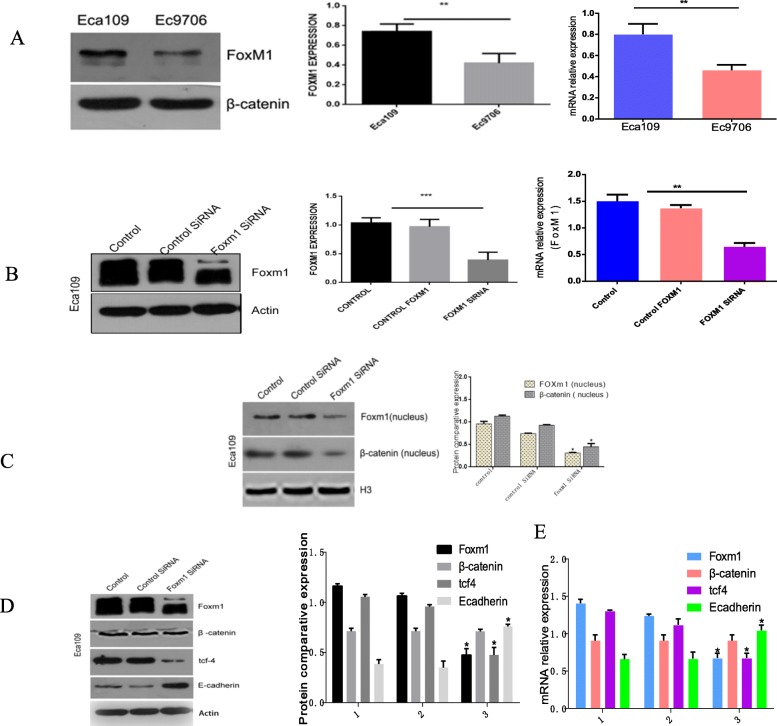
Fig. 4.
a Top panel: Western blotting and RTq-PCR analysis of Foxm1 expression in Eca109 and Ec9706 cells, respectively. Bottom panel: Quantitative analysis *P<0.05; b Top panel: Foxm1 expression of three groups of EC cells following FoxM1 silencing. Bottom panel: Quantitative data for the top panel. *P<0.05; c Top panel: Western blotting to detect Foxm1 and β-catenin expression in the nuclei of the three groups EC cells after FoxM1 silencing. Bottom panel: Quantitative data for the top panel. *P<0.05; d Top panel: Western blotting to detect the expression of Foxm1, β-catenin, tcf4, and E-cad in the three groups of EC cells after FoxM1 silencing. Bottom panel: Quantitative data of the top panel. *P<0.05; e Top panel: RT-PCR to measure the mRNA levels of Foxm1, β-catenin, tcf4 and E-cad in the three groups of EC cells after FoxM1 silencing. Bottom panel: quantitative data for the top panel. *P<0.05

