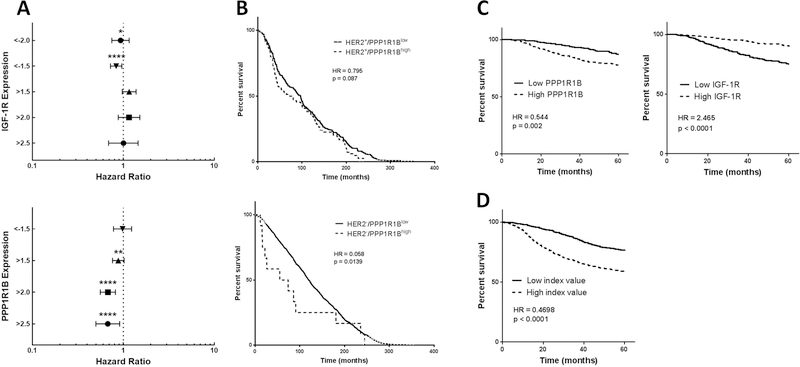
Figure 1. Clinical effect of PPP1R1B and IGF-1R expression.
(A) Forest plots of the hazard ratios for 20 year OS, associated with expression of IGF-1R (top) and PPP1R1B (bottom). (B) Kaplan-Meier survival curves for patients with HER2+ (top) and HER2− (bottom) tumors, comparing tumors with PPP1R1B over-expression (PPP1R1Bhigh) to tumors with normal PPP1R1B (PPP1R1Blow) levels. (C) Kaplan-Meier survival curves for the effect of PPP1R1B (left) and IGF-1R (right) on 5-year OS in breast cancer patients. (D) Kaplan-Meier survival curve using an index value comprised of the mean expression of PPP1R1B and the inverse expression of IGF-1R (PPP1R1B expression + (−1) * IGF-1R expression). HR=hazard ratio; all p-values displayed are log rank values, *p<0.05, **p<0.01, ****p<0.0001.

