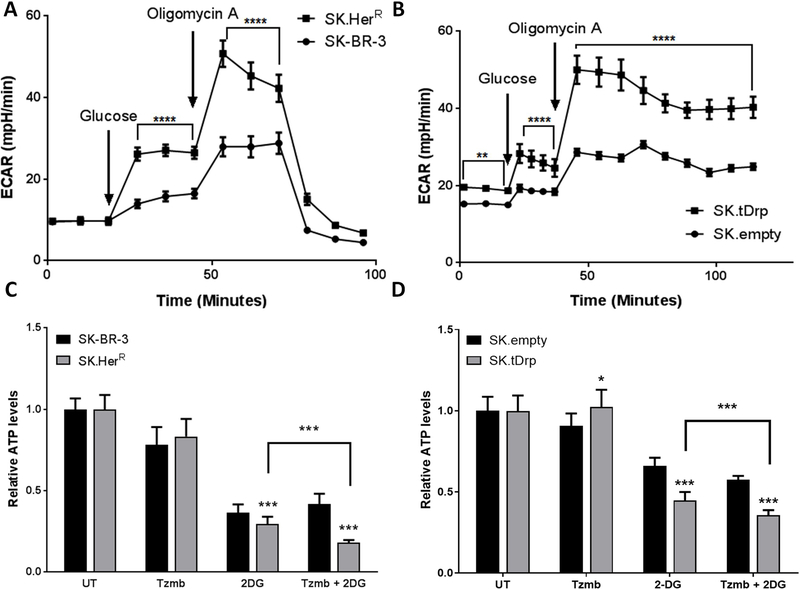
Figure 2. SK.tDrp and SK.HerR cells share similar metabolic characteristics.
(A and B) Seahorse analysis of the metabolic phenotype of SK-BR-3 cells compared to SK.HerR cells (A) and SK.empty cells compared to SK.tDrp cells (B). Assays were performed on the XFe24 flux analyzer. A change in ECAR following injection of glucose indicates glycolysis and a change in ECAR following oligomycin A injection indicates maximal glycolytic capacity. (C and D) Cellular ATP levels were measured in untreated (UT) cells and in cells following 30 min exposure to 2.5µM trastuzumab, 50mM 2-DG, or the combination. Mean values (±S.D.) normalized to UT (=1.0) are reported for SK-BR-3 compared to SK.HerR cells (C) and SK.empty compared to SK.tDrp cells (D). *p<0.05, ***p<0.001, ****p<0.0001

