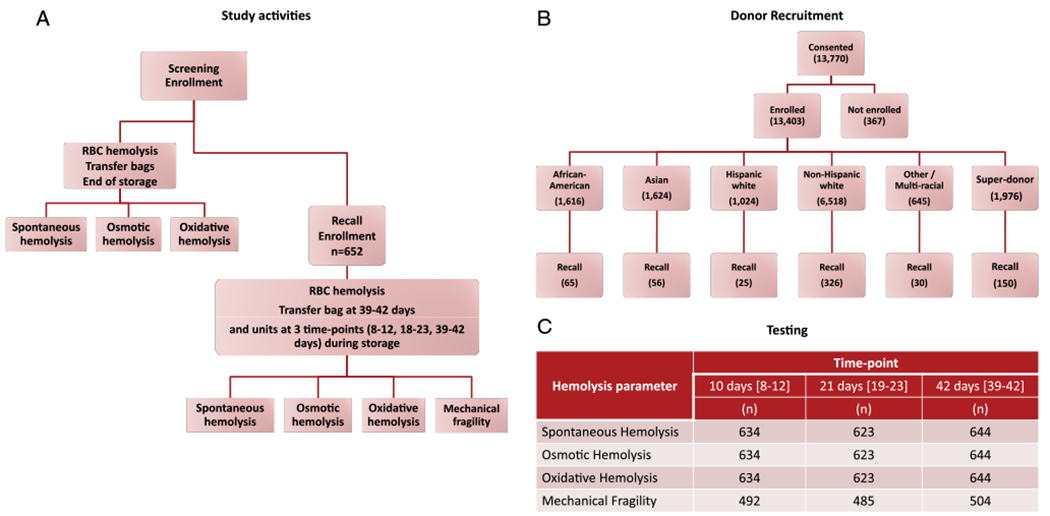
Fig. 1.

RBC-Omics subject enrollment, characteristics recall, and hemolysis variable testing. (A) Flow chart of the RBC-Omics study cohort and donor testing for hemolysis; (B) donor enrollment and recall statistics stratified by self-identified group; (C) count of number of recalled participants successfully completing each of the hemolytic tests at the three time points. [Color figure can be viewed at wileyonlinelibrary.com]
