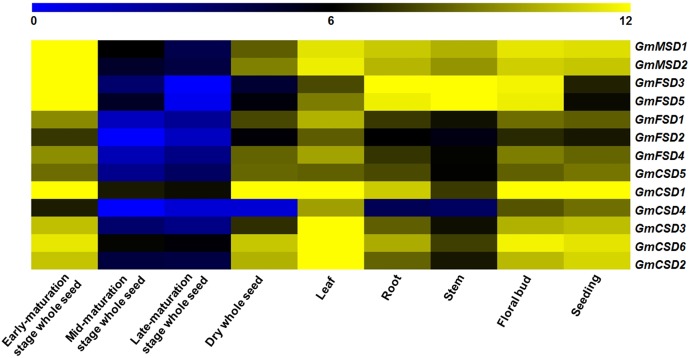
Figure 6. Expression patterns of SOD family genes in different soybean tissues.
The RNA-seq data (GSE29163) were downloaded from the NCBI. All expression data were analyzed by Log2 scaled. The heat map was generated using TM4: MeV4.9 software. The color scale represents the expression values: blue indicates low levels and yellow represents high levels.

