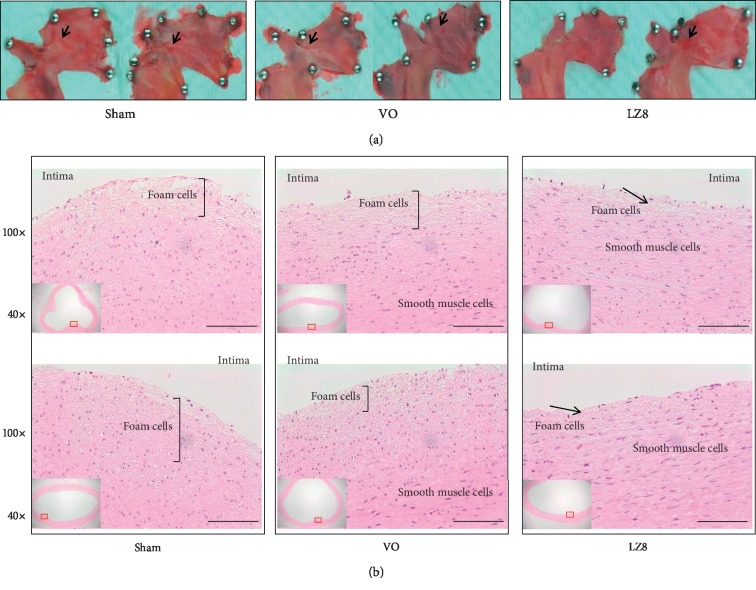
Figure 4.
Histological images of aortic arches from three groups of rabbits after 5 weeks of a high cholesterol diet. (a) Sudan IV staining, arrowhead indicates small plaques in fatty streaks were observed, mostly in the aortic arch from sham group. (b) H&E staining, bracket indicates thickness of the intimal layer and arrow indicated foam cell deposition. Scale bar = 100 μm.

