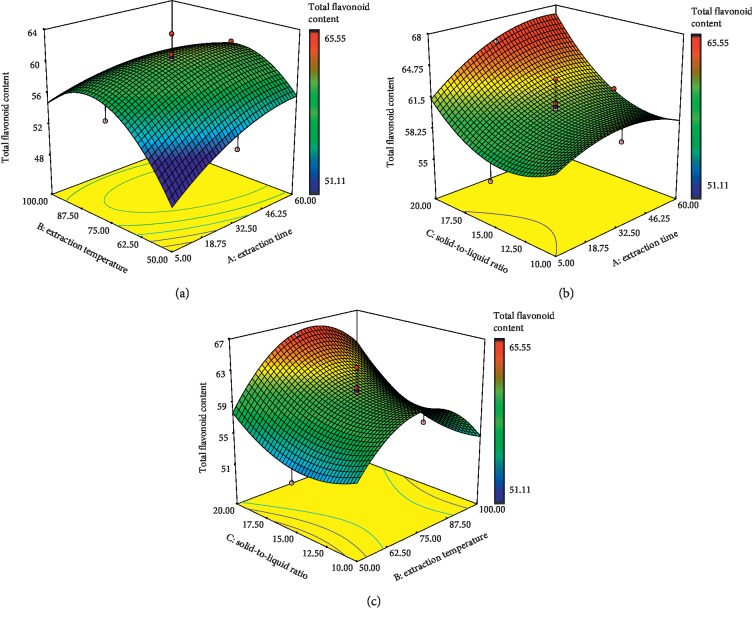
Figure 1.
Response surface plots of E. hirta showing the effect of (a) extraction time and extraction temperature, (b) solid-to-liquid ratio and extraction time, (c) solid-to-liquid ratio and extraction temperature on TFC. Color gradients indicate the level of optimization (red = high, green = intermediate, and blue = low).

