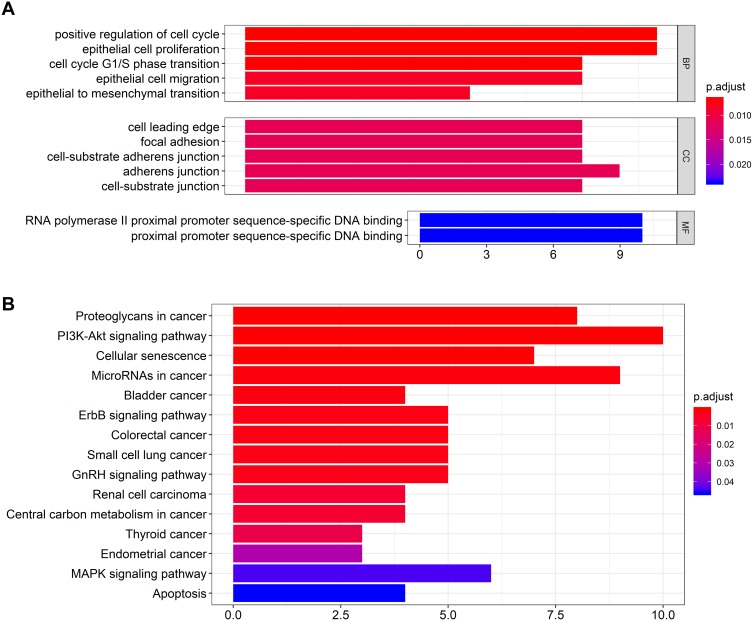
Figure 3.
The bar charts for gene ontology analysis and KEGG pathway analysis for mRNAs in the ceRNA network. (A) Bar chart of gene ontology enriched in all GO, BP, and MF annotations; (B) Bar chart of KEGG pathway analysis.
Abbreviations: GO, gene ontology; CC, cellular component; MF, molecular function.

