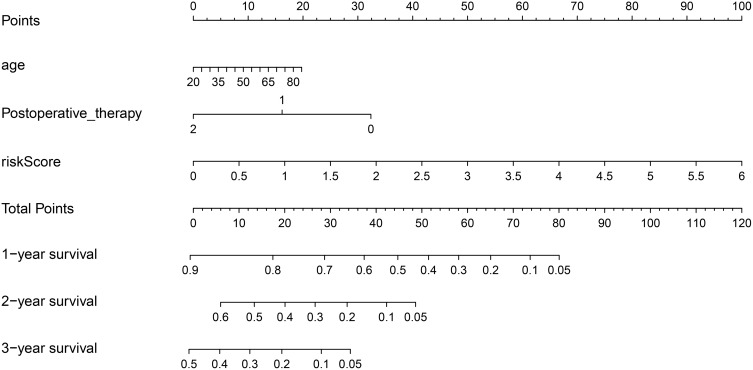
Figure 6.
Nomogram of prognosis (survival probability) prediction for GBM patients. To estimate the rate for a real patient, identify the patient’s regulation type for integrated values of the risk prediction model and clinical characteristics including age and postoperative therapy, draw a line from the observed status for each factors straight upwards to the Points axis to obtain the points a factor. Repeat this procedure until scores for all factors were decided. Sum the points corresponding to all factors and locate the cumulative point on the Total Points axis. Draw a line straight down to the Risk axis to check the rate for the particular patient.

