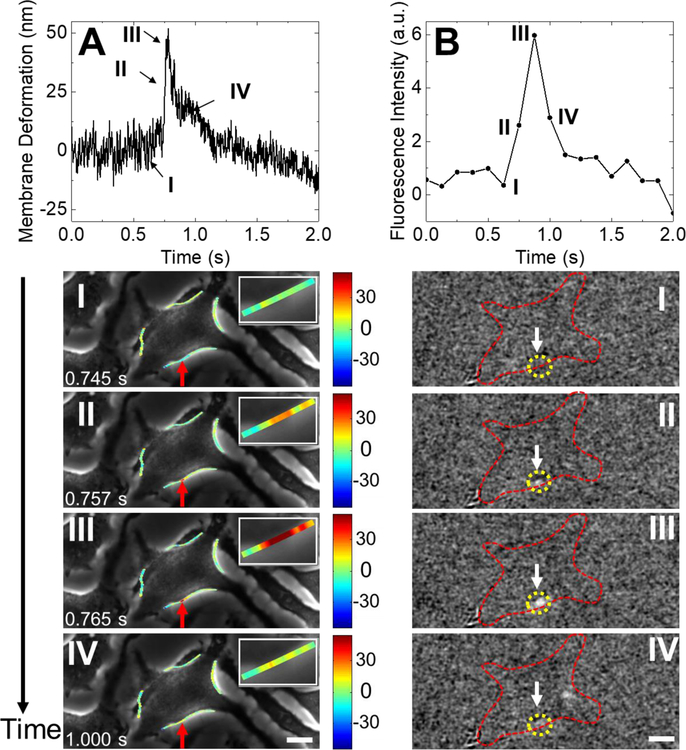
Fig. 3. A vesicle release event and the associated membrane responses.
(A) Top: Temporal profile of pulse-like deformation at the location of vesicle release. Bottom: Snapshots of phase contrast images at the time points marked by I, II, III and IV along the temporal profile, where the insets are zoom-in images of the cell deformation location. (B) Top: Temporal profile of the fluorescence intensity recorded during the vesicle release event shown in (A). Bottom: Snapshots of the fluorescent images at the time points marked by I, II, III, and IV (first frame subtracted out), where the yellow dashed circles mark the location of vesicle release and the red dashed lines mark the cell edge. Scale bar: 10 µm.

