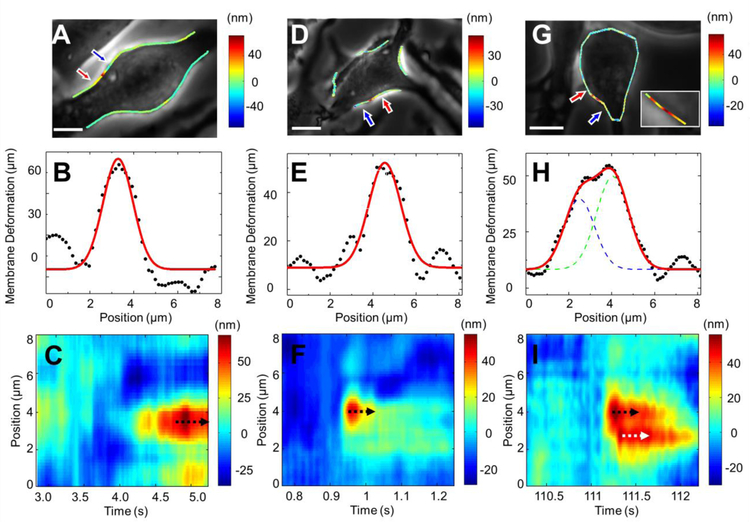
Fig. 4. Spatial distribution and temporal evolution of vesicle-release induced cell deformation.
(A, D and G) Phase contrast images of three cells exhibiting different behaviors, where the colored lines represent the magnitude of cell deformation. The inset in G is the zoom-in image showing two vesicle release events. (B, E and H) Spatial distributions of cell deformation along cell edges marked by the red and blue arrows in the corresponding cells shown in A, D and G, where the black dots are the experimental data and the red lines are Gaussian fitting to the experimental data. (C, F and I) Kymographs of cell deformation for the cells shown in A, D and G, respectively, where the color scale represents the magnitude of the deformation. Scale bar: 10 µm.

