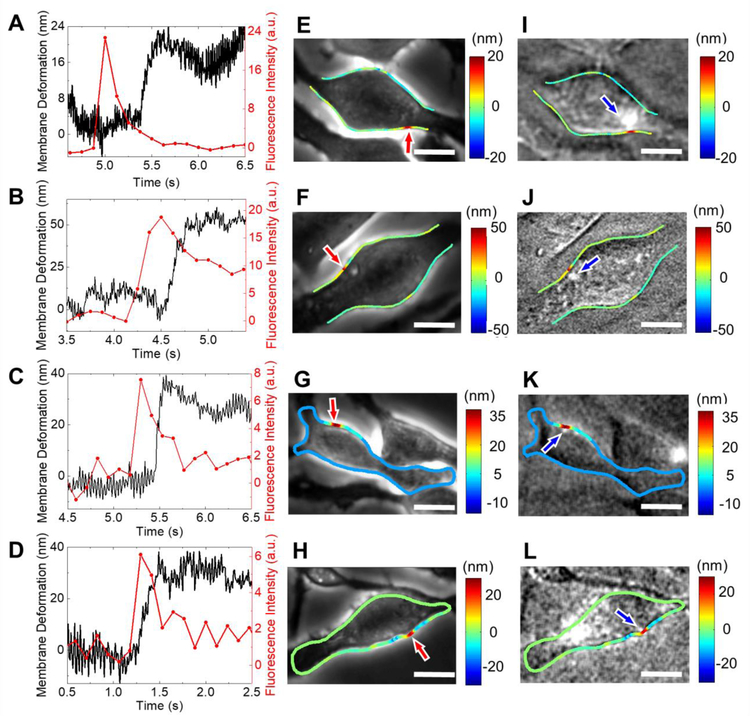
Fig. 5. Propagation of exocytosis-induced cell membrane deformation on cell surfaces.
(A-D) Temporal profiles of cell membrane deformation (black) and corresponding fluorescence signals (red) associated with vesicle release in different RBL-2H3 cells. (E-H) Phase contrast images of the corresponding cells, where the red arrows indicate the locations of the membrane deformation and colored spots represent the magnitudes of the local membrane deformation in nm. (I-L) Fluorescence images of the cells shown in (E-H), where the colored lines represent the local membrane deformation. Scale bar: 10 µm.

