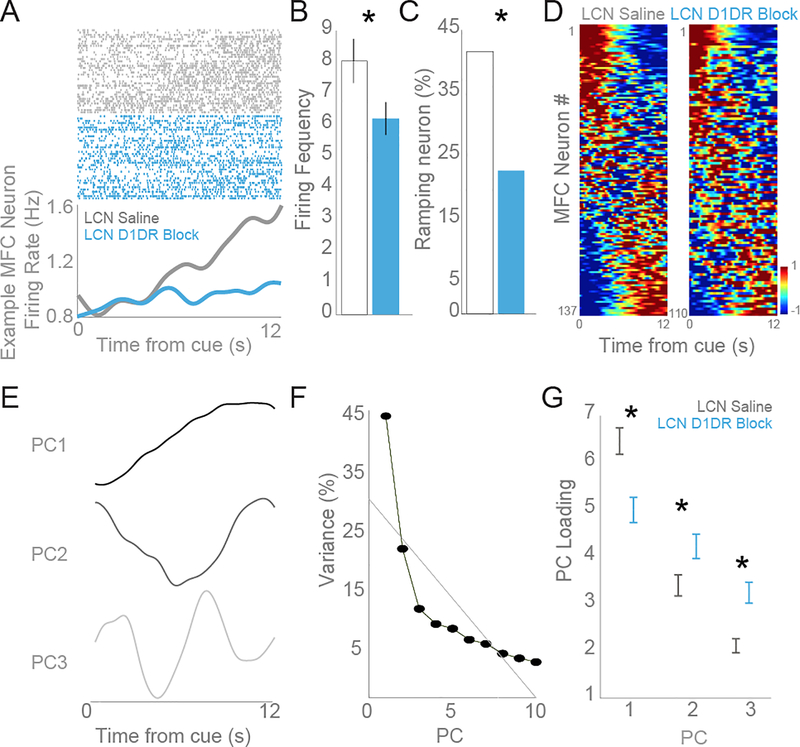
Fig 5: Blocking D1DRs in the LCN attenuated ramping activity in the frontal cortex.
Neurons in the frontal cortex ramp to encode the passage of time. A) An individual example of a neuron with robust time-related ramping – i.e, neural activity that consistently increased / decreased activity over the interval is shown. Peri-event rasters are sorted with respect to mean response time, with trials with a short mean response time on the bottom and trials with a longer mean response time on top. Single neurons were isolated based on waveform and interspike intervals. A raster plot (top) indicates the activity of a single unit where each dot represents an action potential. Rasters are sorted by mean response time. The average activity histogram (bottom) shows that the ramping activity from a putative single unit in the saline condition (gray) has an attenuated ramping pattern following D1DR blockade (blue). From six animals, a total of 137 frontal neurons were recorded following saline infusion in the LCN and 110 following LCN D1DR blockade. B) The firing frequency was reduced from 8.04 to 6.22 following LCN D1DR blockade. C) Regression analyses revealed that 57 of 137 MFC neurons (42%) had a consistent ramp over time following LCN saline while LCN D1DR blockade diminished the number of MFC ramping neurons to 25 of 110 neurons (23%). D) Heat-maps of peri-event time histograms revealed that time-related ramping was a ubiquitous feature of MFC neurons in the saline condition (left) and this pattern was changed following LCN D1DR blockade (right). Neurons are sorted based on PC1. Color scale is at bottom right. E) Principal component analysis, a data-driven technique, identified interval-related ramping as the first principal component in the MFC. F) The amount of variance explained by PC1 was 44%, 21% for PC2, 11% for PC3. G) The weight of PC1 was significantly reduced following LCN D1DR blockade in comparison to saline condition whereas the weight of PC2 significantly increased following LCN D1DR blockade. Asterisk indicates significance at p<0.05 via t-test, displayed as mean +/− SEM.

