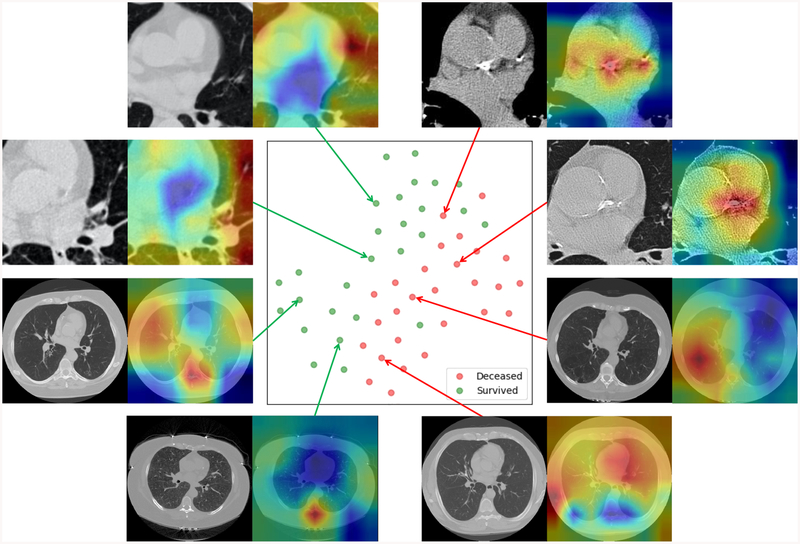
Fig. 6:
The scatter plot in the center is the t-SNE representation of combined feature vectors Each feature vector is the concatenation of one 2048D feature vector (from slice-input network stream) and one 512D feature vector (from patch-input network stream). Each green dot represents a survivor and a red dot denotes a non-survivor. The green dots and red dots are roughly separated from each other. Eight cases (four with cardiac patches and the other four with whole slices) are randomly selected to show the generated heatmaps.

