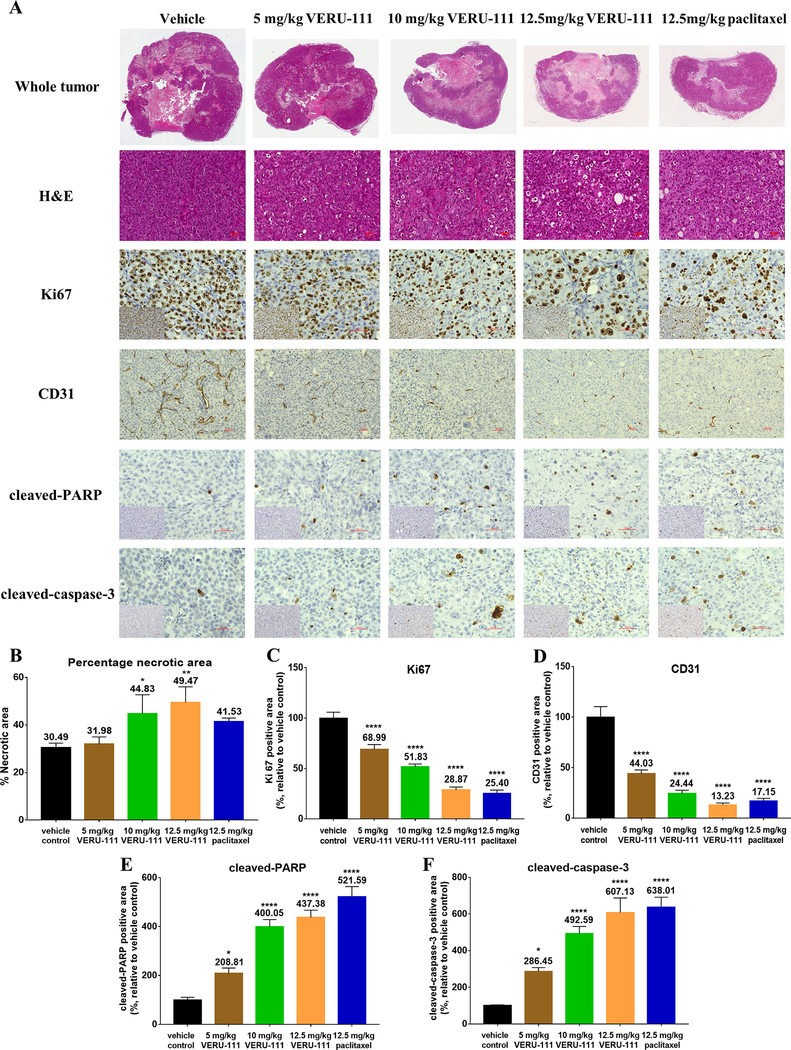
Figure 5.
VERU-111 therapy induces tumor necrosis, represses proliferation and angiogenesis, and induces apoptosis in vivo. (A) Representative images of H&E-stained whole tumor sections bisected at the widest width and representative stained slides following immunostaining with Ki67, CD31, cleaved-PARP and cleaved-caspase-3. Images were captured at either 20x or 40x magnification, scale bar = 50 μm. Inserts show low power images. (B) Quantification of the mean percentage of necrotic area ± SEM of H&E sections as scored by an experienced pathologist, expressed relative to the vehicle control. (C-F) Quantification of the mean percentage ± SEM of Ki67 (C), CD31 (D), cleaved-PARP (E) and cleaved-caspase-3 (F)-positive cells relative to the vehicle control group (100%), the mean value is indicated above each group. All p-values are were determined by one-way ANOVA followed by a multiple comparisons test.

