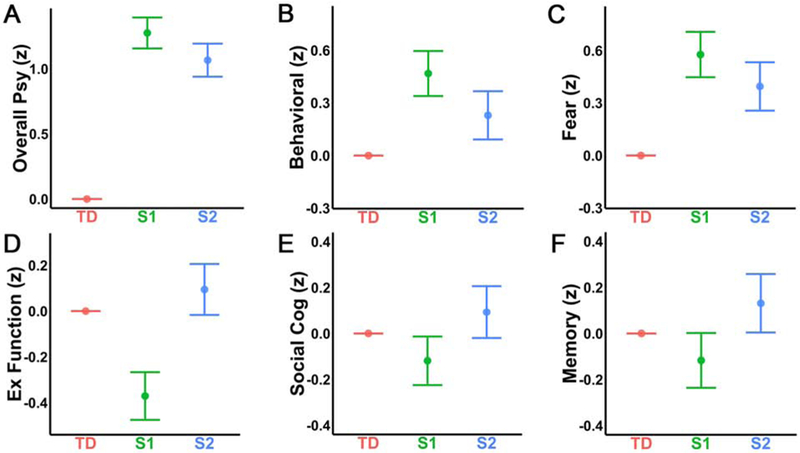
Figure 3. Subtype 1 shows greater psychopathology and poorer cognitive performance.

Estimates are shown on the Y-axis from the fitted model testing for group differences in each domain. Each vertical line represents the 95% confidence interval (CI), with the comparison group (typically developing youth: TD) represented by its mean line. The subtype is significantly different from TD if its corresponding CI does not contain 0 (the mean of TD). To examine differences in psychopathology, symptoms were summarized into anxious-misery, psychosis, behavioral, fear, and overall psychopathology factors (28, 29, 60). As expected, both Subtype 1 (S1) and Subtype 2 (S2) showed greater levels of psychopathology compared to TD across all psychopathology factors, thus, we focus on the differences between S1 and S2. S1 showed higher levels of A) overall psychopathology, B) behavioral symptoms, and C) fear symptoms than S2. There were no significant differences between S1 and S2 for the anxious-misery or psychosis factors. In terms of cognition, S1 showed significantly lower performance on D) executive functioning tasks than both TD and S2; S2 did not differ from TD. S1 also performed more poorly relative to the other two groups in terms of E) social cognition, while S2 again did not differ from TD. Additionally, S1 performed significantly below S2 on F) episodic memory; however, neither S1 nor S2 significantly differed from TD.
