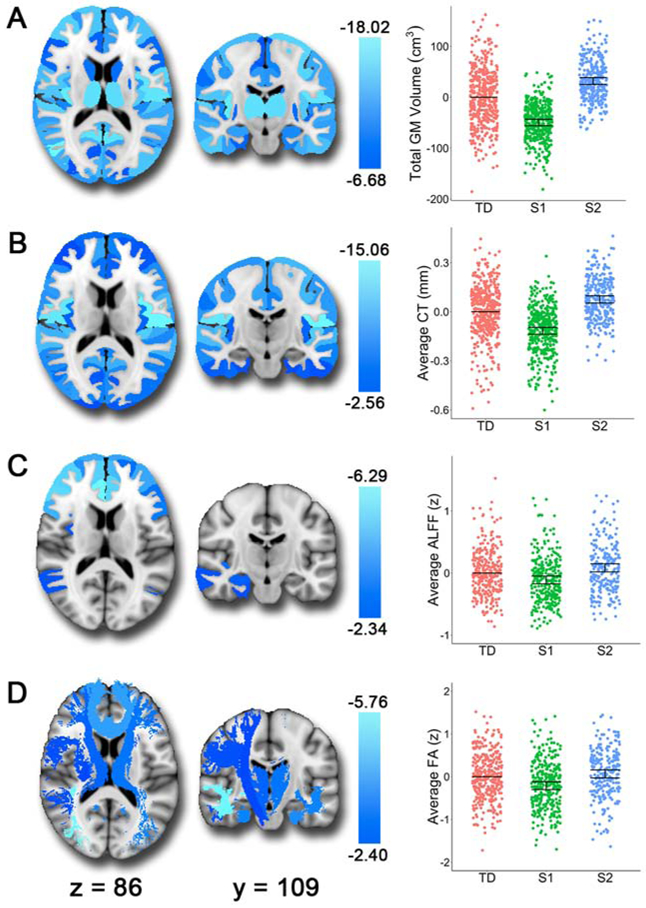
Figure 4. Subtype 1 (S1) shows smaller volume, thinner cortex, lower resting-state ALFF, and reduced white matter integrity relative to Subtype 2 (S2).

The brain images show the t-values for the S1>S2 contrast. In the scatterplots, we show the estimates from the fitted GAM model with all three groups for comparison. Each vertical line represents the 95% confidence interval (CI), with the comparison group (typically developing youth: TD) represented by its mean line. The subtype is significantly different from TD if its corresponding CI does not contain 0 (the mean of TD). A) S1 showed smaller volumes than S2 consistently across the brain. B) In terms of cortical thickness, S1 shows reduced cortical thickness compared to S2 in all regions except the left and right entorhinal cortices. C) S1 also demonstrated reduced resting-state ALFF (amplitude of low-frequency fluctuations) in frontal regions, the right amygdala, and the right hippocampus compared to S2. D) Finally, relative to S2, we found that S1 showed reduced fractional anisotropy in white matter tracts including the inferior longitudinal fasciculi, uncinate fasciculus, anterior thalamic radiation, corticospinal tract, parahippocampal cingulum bundle, superior longitudinal fasciculus, and forceps minor.
