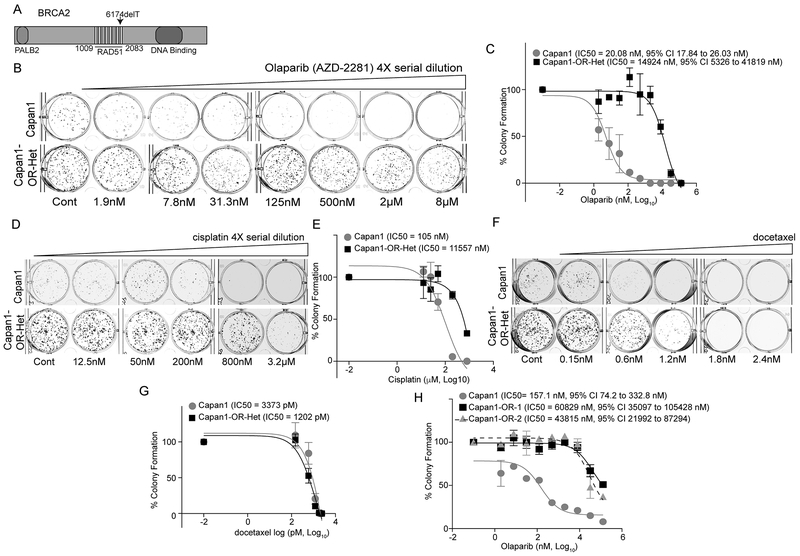
Figure 1. PARP inhibitor resistant cells are cross resistant to DNA damaging agent.
A) The Capan1 pancreatic adenocarcinoma cell line has a deletion at position 6174. B) Capan1 and heterogeneous population of olaparib resistant Capan1 (Capan1-OR-Het) cells were plated on 24-well plates, treated with indicated doses of olaparib, and subjected to colony formation after 12 days. Representative images of colony formation are shown. C) Dose response curve was calculated with Capan1 (gray) and Capan1-OR-Het (black). Calculated IC50 values with 95% Confidence Intervals (CI) are indicated. D) Same as B, but examined the sensitivity to a DNA damaging agent, cisplatin, in Capan1and Capan1-OR-Het cells. Cells were treated with indicated doses. Representative images of foci formation assay are shown. E) Same as C, but a cisplatin dose response curve for Capan1 (gray) and Capan1-OR-Het (black) was calculated. F) Same as B, but sensitivity to a microtubule stabilization agent, docetaxel, was assessed in Capan1and Capan1-OR-Het cells. Cells were treated with indicated doses. Representative images of foci formation assay are shown. G) Same as C, but a docetaxel dose response curve for Capan1 (gray) and Capan1-OR-Het (black) was calculated. H) Same as C, but clonal olaparib resistant populations (Capan1-OR-1 [squares] and -2 [triangles]) were isolated and examined for olaparib sensitivity compared to Capan1 cells (circles). Colonies were counted with ImageJ software. Data is representative of 3 independent experiments. Error bars = S.E.M.

