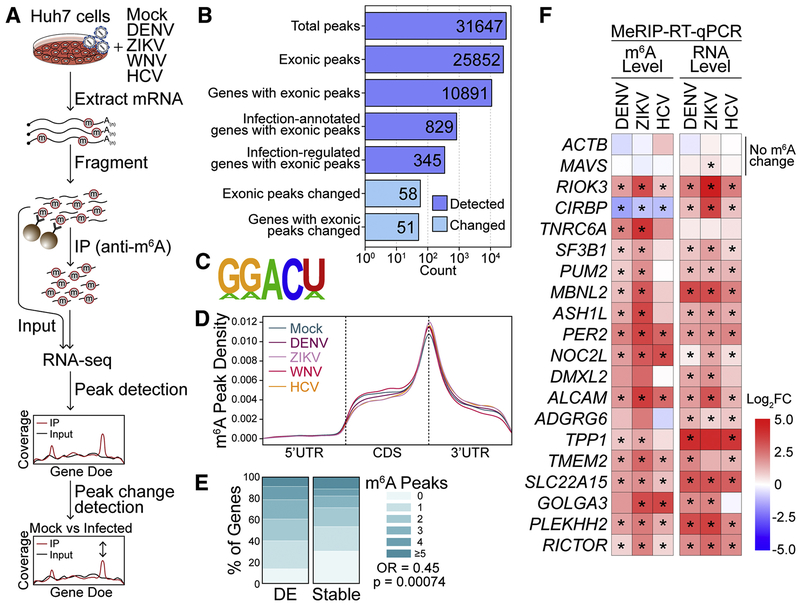
Figure 1: Flaviviridae infection alters m6A modification of specific transcripts.
(A) Schematic of the MeRIP-seq protocol used to identify differential m6A methylation following infection of Huh7 cells with DENV, ZIKV, WNV, and HCV. RNA was harvested at 48 hours post-infection (hpi) and experiments were performed in triplicate. (B) The number of peaks and genes with m6A peaks detected in ≥ 2 mock- or virus-infected samples (dark blue; MACS2 q-value < 0.05) and peaks that change during infection (light blue, |peak – gene Log2FC| ≥ 1, adjusted p < 0.05). “Infection-annotated genes:” genes with known annotations for the Reactome Pathways ‘Infectious Disease’, ‘Unfolded Protein Response’, ‘Interferon Signaling’, or ‘Innate Immune Signaling’ in the database used by fgsea. “Infection-regulated genes:” genes that show a Log2FC in gene expression ≥ 2 in RNA expression between mock- and virus- infected samples (adjusted p < 0.05). (C) The most significantly enriched motif in the MeRIP fractions across all samples (HOMER, p = 1e-831). (D) Metagene plot of “methylated” DRACH motifs (detected in a peak in at least two replicates) across transcripts in mock- and virus- infected cells. (E) The percent of genes with m6A peaks that changed expression with infection (|Log2FC| ≥ 2, adjusted p < 0.05, N = 137) and genes that remained stable (|Log2FC| < 0.5, adjusted p > 0.05, N = 7627) for transcripts with mean expression ≥ 50 reads. (F) (Left) MeRIP-RT-qPCR analysis of relative m6A level of transcripts with infection-altered m6A modification or controls (ACTB and MAVS) in DENV, ZIKV, and HCV-infected (48 hpi) Huh7 cells. (Right) RNA expression of these transcripts relative to GAPDH. Values in heatmap are the mean of 3 independent experiments. * p < 0.05, by unpaired Student’s t test. See also Figure S1 and Table S1 and S2.

