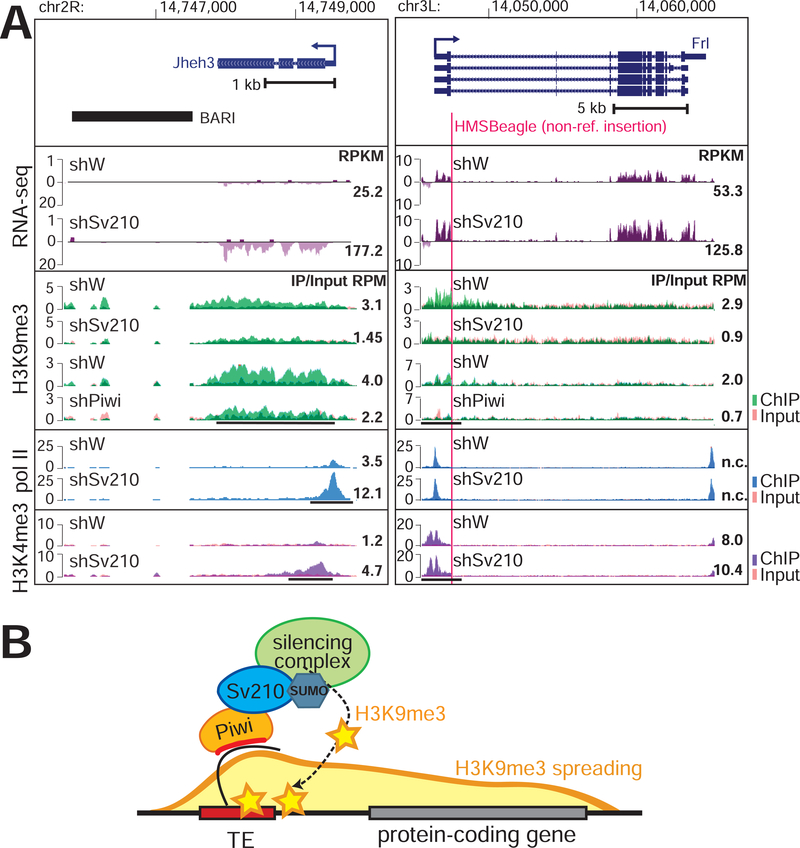
Figure 2. Epigenetic effect of TE-dependent H3K9me3 on adjacent protein-coding gens.
(A) Examples of euchromatic genes adjacent to a reference TE (left) or hosting a non-reference TE (right; red line marks TE integration site). Tracks show RPM-normalized coverage of RNA-seq and ChIP-seq data for indicated marks and conditions. ChIP and Input signals are overlaid. Top panels show the gene structures at corresponding loci. Arrows indicate the direction of transcription. Numbers show RPKM values of exonic regions (RNA-seq, estimated by eXpress) or normalized ChIP/Input signal (ChIP-seq) in manually selected genomic intervals indicated by black bars. (B) Model of piRNA-dependent H3K9me3 deposition at euchromatic TEs and its spreading to adjacent genes.

