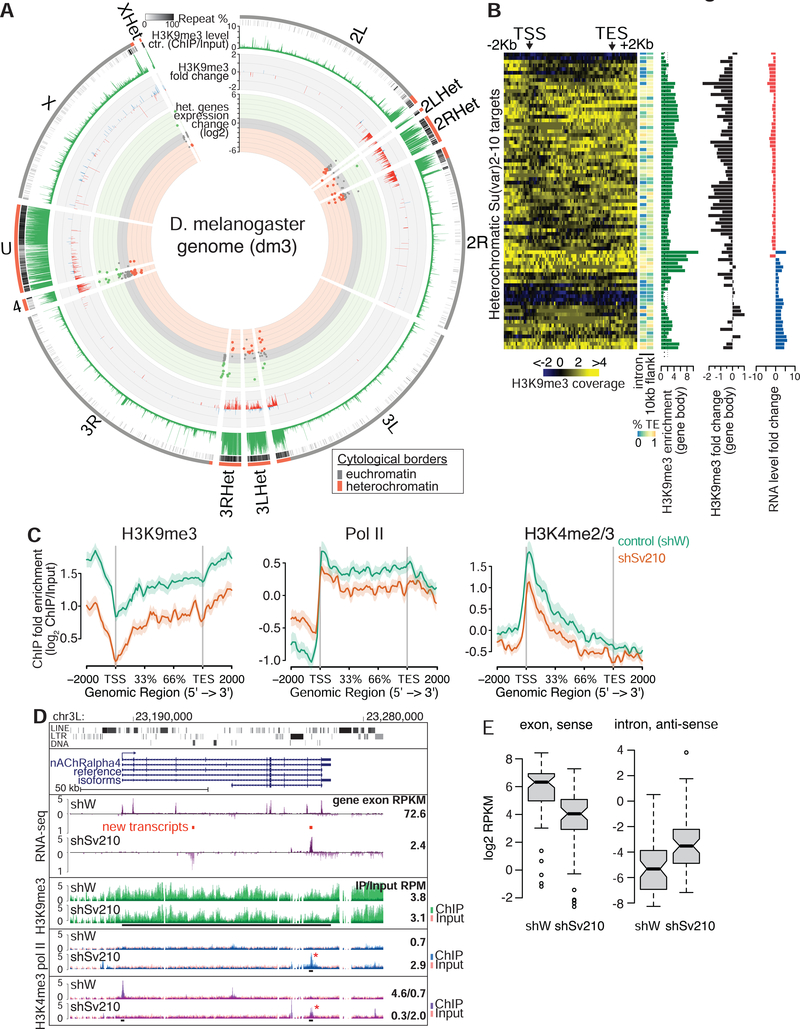
Figure 3. Su(var)2–10 and H3K9me3 are required for heterochromatic gene expression.
(A) Circle plot of the D. melanogaster chromosome arms and heterochromatic scaffolds (dm3). Dots represent positions and RNA fold changes upon Su(var)2–10 GLKD for genes residing within annotated heterochromatin boundaries. Bargraphs show H3K9me3 levels in control ovaries and fold changes upon Su(var)2–10 GLKD for >2-fold H3K9me3-enriched intervals (5Kb genomic intervals, see Methods). (B) Heatmaps of H3K9me3 distribution across heterochromatic Su(var)2–10 targets in control ovaries; side bars show % repeats in indicated regions; barplots show total H3K9me3 enrichment, and H3K9me3 and RNA fold changes upon Su(var)2–10 GLKD. (C) Average profiles of H3K9me3, H3K4me2/3 and RNA Pol II over gene bodies of heterochromatic genes downregulated upon Su(var)2–10 GLKD in indicated conditions. Shaded areas reflect standard errors. See also Figure S2. (D) Tracks show RPM-normalized RNA-seq and ChIP-seq coverage at the nAChRalpha4 locus in indicated conditions. Red bars indicate predicted novel transcripts; asterisks indicate new peaks that appear upon Su(var)2–10 GLKD. Numbers are as in Fig 2. (E) RNA levels from sense exonic and antisense intronic regions of heterochromatic genes in indicated conditions. Data in A-C, E are averages from two biological replicates.

