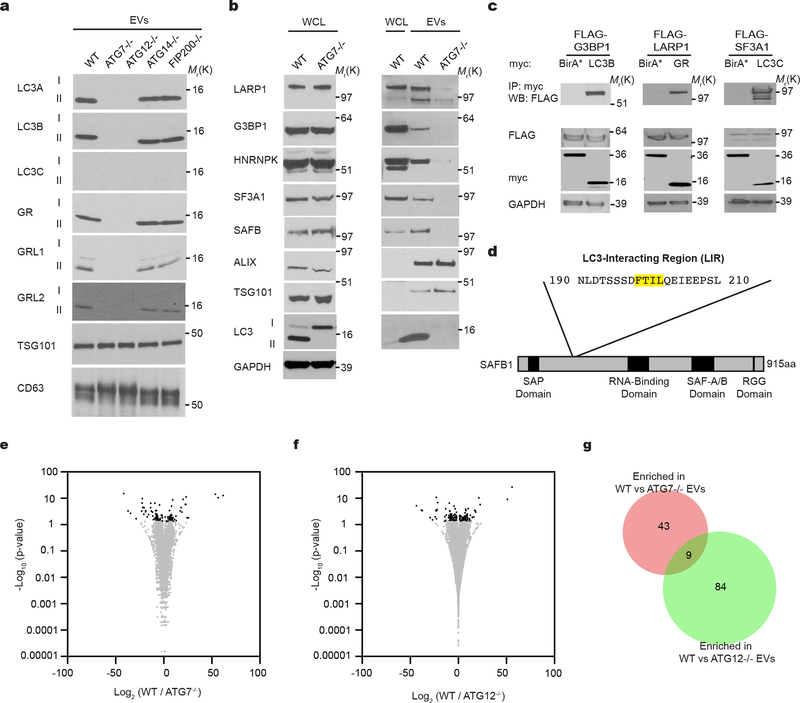
Extended Data Fig. 5: LC3-conjugation machinery controls EV-mediated secretion of diverse RBPs.
a, EVs from WT and ATG deficient cells normalized for protein concentration and immunoblotted to detect endogenous LC3A, LC3B, LC3C, GABARAP (GR), GABARAPL1 (GRL1), GABARAPL2 (GRL2), and indicated marker proteins (n=2 biologically independent experiments). b, Whole cell (WCL) and EV lysates from WT and ATG7−/− cells were normalized for protein concentration and immunoblotted for indicated proteins (n=3 biologically independent experiments). c, HEK293T cells co-transfected with FLAG-tagged G3BP1, LARP1 or SF3A1, and myc-tagged LC3B, GABARAP (GR), LC3C respectively, or myc-BirA* were lysed, immunoprecipitated (IP) with anti-myc antibody and immunoblotted (WB) with indicated antibodies (n=3 biologically independent experiments). d, Diagram mapping the domains and primary LC3-interaction region (LIR) in SAFB. e, Volcano plot of mRNA and long non-coding RNA (large RNA) detected in EVs from WT and ATG7−/− cells. Results plotted according to -log10 p-values as determined by DESeq2 and log2 fold enrichment (n=3 biologically independent samples; WT/ATG7−/−). Grey dots: RNAs not enriched in EVs from WT or ATG7−/− cells identified with a p-value >0.05 and/or log2 fold change between −0.5 and 0.5 (−0.5<log2FC<0.5). Black dots: Large RNAs enriched in EVs from WT cells or ATG7−/− cells. f, Volcano plot of mRNA and long non-coding RNA (large RNA) detected in EVs from WT and ATG12−/− cells. Results plotted according to -log10 p-values as determined by DESeq2 and log2 fold enrichment (n=3 biologically independent samples; WT/ATG12−/−). Grey dots: RNAs not enriched in EVs from WT or ATG12−/− cells identified with a p-value >0.05 and/or log2 fold change between −0.5 and 0.5 (−0.5<log2FC<0.5). Black dots: Large RNAs enriched in EVs from WT or ATG12−/− cells. g, Venn diagram showing the overlap of mRNA and long non-coding RNAs (large RNAs) enriched in EVs from WT relative to ATG7−/− cells and EVs from WT relative to ATG12−/− cells. Data and unprocessed blots available in Source Data Extended Data Fig. 5.

