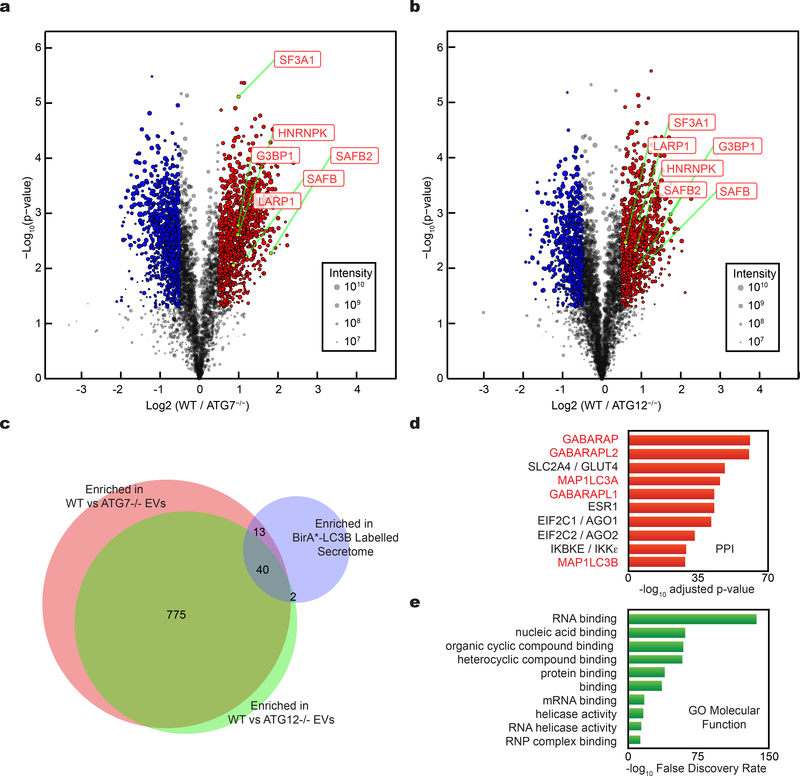
Figure 4. Tandem mass tag (TMT) quantitative secretomics identifies EV proteins secreted via the LC3-conjugation machinery.
a, Volcano plot of proteins identified within EVs from wild-type (WT) and ATG7−/− HEK293T cells quantified by TMT mass spectrometry. TMT labelled proteins plotted according to their -log10 p-values as determined by two-tailed t-test and log2 fold enrichment (WT/ATG7−/−; n=4 biologically independent samples). Grey dots: Proteins not relatively enriched in EVs from WT or ATG7−/− cells identified with p-value >0.05 and/or log2 fold change between −0.5 and 0.5 (−0.5<log2FC<0.5). Red dots: Proteins significantly enriched in EVs from WT cells relative to ATG7−/− cells. Blue dots: Proteins significantly enriched in EVs from ATG7−/− cells relative to WT cells. Dot size proportional to sum of the signal intensity for identified proteins. b, Volcano plot of proteins identified within EVs from WT and ATG12−/− cells. TMT labelled proteins according to their -log10 p-values as determined by two-tailed t-test and log2 fold enrichment (WT/ATG12−/−; n=4 biologically independent samples). Grey dots: Proteins not relatively enriched in EVs from WT or ATG7−/− cells identified with p-value >0.05 and/or log2 fold change between −0.5 and 0.5 (−0.5<log2FC<0.5). Red dots: Proteins significantly enriched in EVs from WT cells relative to ATG12−/− cells. Blue dots: Proteins significantly enriched in EVs from ATG12−/− cells relative to WT cells. Dot size proportional to sum of the signal intensity for identified proteins. c, Venn diagram showing overlap of proteins enriched in EVs from WT cells relative to ATG7−/− cells, EVs from WT cells relative to ATG12−/− cells, and proteins enriched within the BirA*-LC3B labelled secretome. d, Ranked list of proteins with greatest connectivity to the 815 proteins enriched in EVs from WT cells relative to ATG7−/− and ATG12−/− cells. Statistical significance calculated in Enrichr by one-way Fisher’s exact test and adjusted using the Benjamini–Hochberg method. LC3/ATG8 family members highlighted in red. e, Gene Ontology (GO) enrichment analysis of 815 proteins enriched in EVs from WT cells relative to ATG7−/− and ATG12−/− cells with the top terms for molecular function plotted according to -log10 False Discovery Rate. Statistical significance calculated by one-way Fisher’s exact test. Data available in Source Data Fig. 4.

