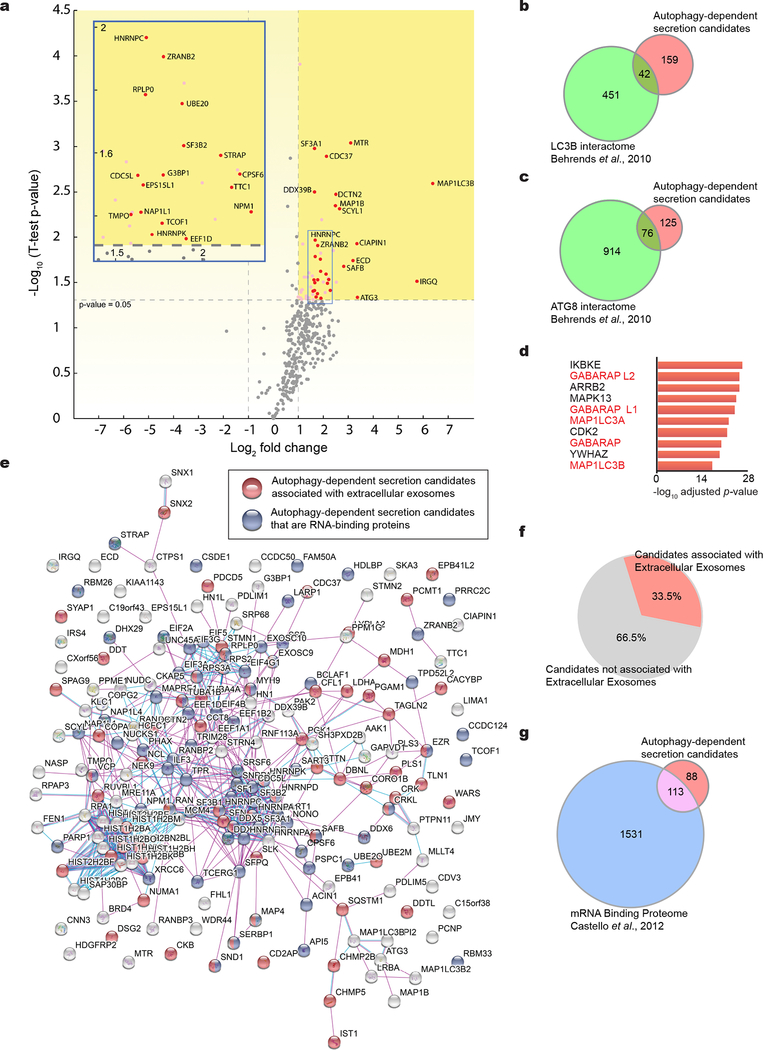
Extended Data Fig. 2: BirA*-LC3B-labelled secretome is enriched in RBPs.
a, Volcano plot of BirA*-LC3-labeled secretome quantified by mass spectrometry. SILAC labelled biotin-tagged proteins plotted according to -log10 p-values as determined by two-tailed t-test and log2 fold enrichment (BirA*-LC3/BirA*) (n=3 biologically independent samples). Grey horizontal dotted line: significance cut-off with p-value of 0.05. Log2 fold change reflects LC3-BirA* to BirA* alone ratio. Grey vertical dotted line: 2-fold enriched and de-enriched cut-off. Pink: significantly enriched proteins relative to BirA* alone. Red: Class I enriched proteins represented in heat map in Figure 1. Inset: Expanded view of significantly enriched proteins. b, Venn diagram showing overlap of secretory autophagy candidates (Class I and II hits) with the LC3B intracellular interactome defined in Behrends et al. 2010. c, Venn diagram showing the overlap of secretory autophagy candidates (Class I and II hits) with the entire ATG8 intracellular interactome defined in Behrends et al. 2010. d, Ranked list of proteins with greatest connectivity to secretory autophagy candidates as determined by the Enrichr gene enrichment analysis tool (n=3 biologically independent samples; 200 enriched proteins in Class I + II datasets). Statistical significance calculated by one-way Fisher’s exact test and adjusted using the Benjamini–Hochberg method. LC3/ATG8 family members highlighted in red. e, Network map of autophagy-dependent secretion candidates. Class I and II secretory autophagy candidates mapped to zero-order protein interaction network using Search Tool for the Retrieval of Interacting Genes/Proteins (STRING) and proteins associated with extracellular exosomes or with RNA-binding functions coloured in red and blue, respectively. f, Pie chart plotting percentage of Class I and II secretory autophagy candidates assigned to Gene Ontology (GO) term extracellular exosome by PANTHER. g, Venn diagram showing overlap of class I and II secretory autophagy candidates with the mRNA binding proteins from Castello et al. 2012. Data available in Source Data Extended Data Fig. 2.

