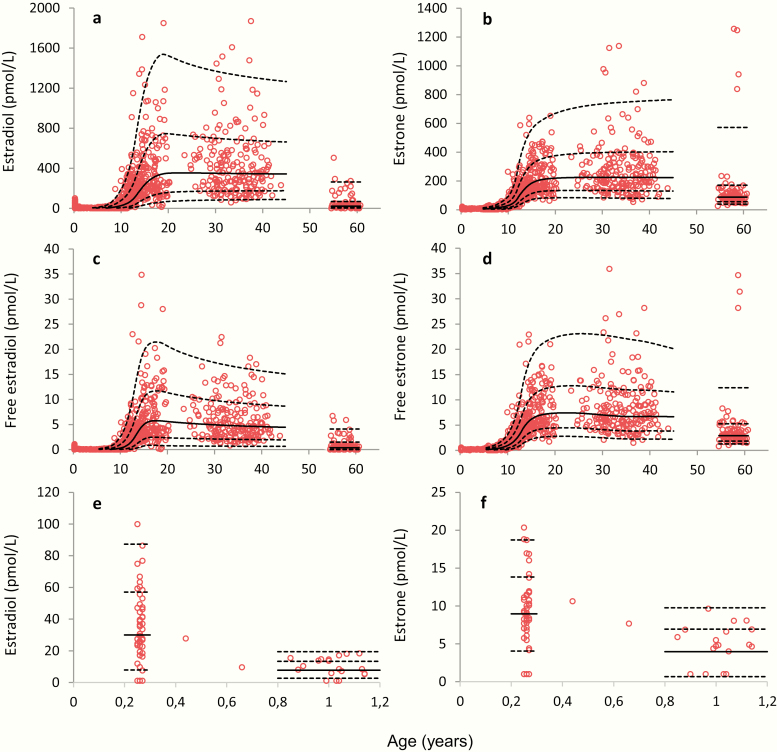
Figure 2.
Female serum concentrations of (a) estradiol (E2) and (b) estrone (E1) as a function of age from 0.25 to 61 years, n = 1007; calculated (c) free E2 and (d) free E1 from 0.25 to 61 years, n = 936 and (e) E2 and (f) E1 from 0.25 to 1.14, years n = 65. Solid lines represent medians (50 percentile), and dashed lines represent the 2.5, 16, 84, and 97.5 percentiles (corresponding to ± 1 and ± 2 standard deviations, respectively).

