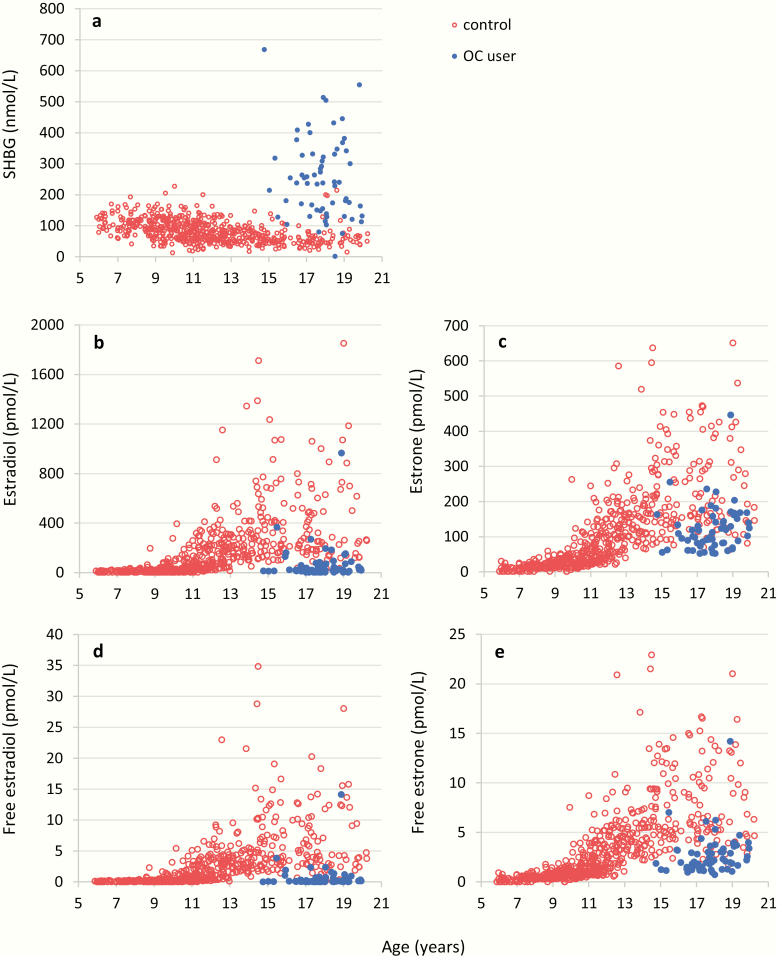
Figure 8.
Female serum concentrations (n = 666) of (a) sex hormone binding globulin (SHBG), (b) estradiol (E2), (c) estrone (E1), (d) free estradiol (free E2), and (e) free estrone (free E1) by age, separated into users (blue dots, n = 62) and nonusers (red dots, n = 603) of oral contraceptives (OC).

