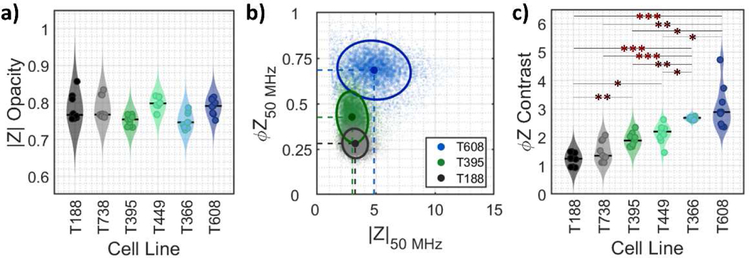
Fig 3.
Electrical properties for PDAC samples calculated using multi-frequency impedance data: a) magnitude opacity and c) phase contrast for PDAC cells. Violin plots show population distribution for each cell line (color-coded) with median values (solid line). Overlaying markers show individual means (n = 9) for all cell lines. Statistical significance (post Bonferroni correction for multiple comparisons): *p ≲ 0.003 level; **p ≲ 0.0007 level; ***p ≲ 0.00007 level. b) Impedance phase (ϕZ) is plotted against magnitude (|Z|) for met mut T608, pri mut T395 and pri wt T188 at 50 MHz. Circular markers (color-coded) with dashed red lines show population means and annotated confidence ellipses, which contain ~50% of detected events. Each scatter plot shows ~6000 plotted events.

