Fig 6:

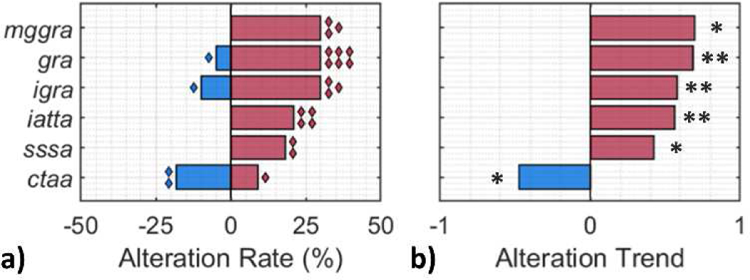
Gene sets associated with ion/ solute transport in PDAC cells were enriched for differential expression when comparing KRAS mutant to KRAS wild-type samples. (a) Proportion of upregulated (red) and downregulated (blue) genes within each gene set from a collection of GO (Gene Ontology) terms describing molecular functions. Diamond markers indicate the number of genes with dysregulated expression using gene set variability analysis. (b) Overall expression dysregulation trend for each gene set. Darker shade indicates larger variation in (a) rate or (b) trend. gra = glutamate receptor activity; igra = ionotropic glutamate receptor activity; mggra = metabotropic glutamate GABAB-like receptor activity; iatta = inorganic anion transmembrane transporter activity; sssa = solute sodium symporter activity; and ctaa = cation transporting ATPase activity. Statistical significance: *p < 0.05 level; **p < 0.01 level.
