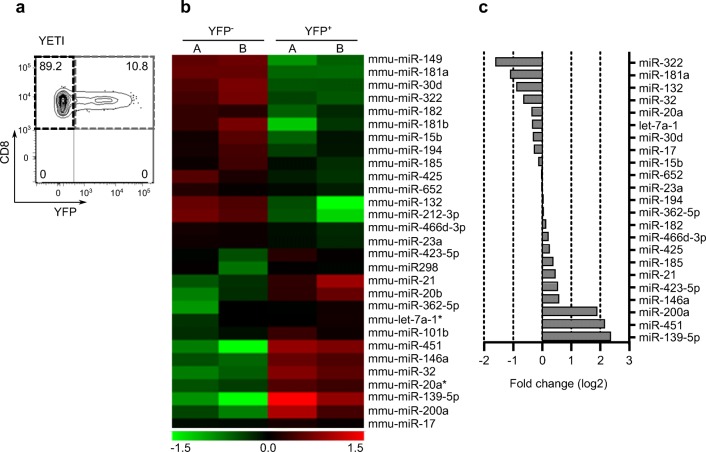
Fig. 2.
Differential expression analysis of microRNAs segregating with IFN-γ expression in CD8+ T cells. (a) Isolation by FACS of YFP− vs YFP+ thymic CD8+ T cells from YETI mice for qPCR profiling. (b) Heatmap of differentially expressed genes between YFP− and YFP+ CD8+ thymic T cells. The color scale shown at the bottom illustrates the relative expression level of a miRNA across all samples: red color represents an expression level above mean, and green color represents expression lower than the mean. (c) qPCR validation of selected miRNA genes’ differential expression between IFN-γ-producing vs nonproducing thymic CD8+ T cells. miRNAs enriched in YFP− have negative log2 fold change values while miRNAs enriched in YFP+ have log2 fold change positive values

