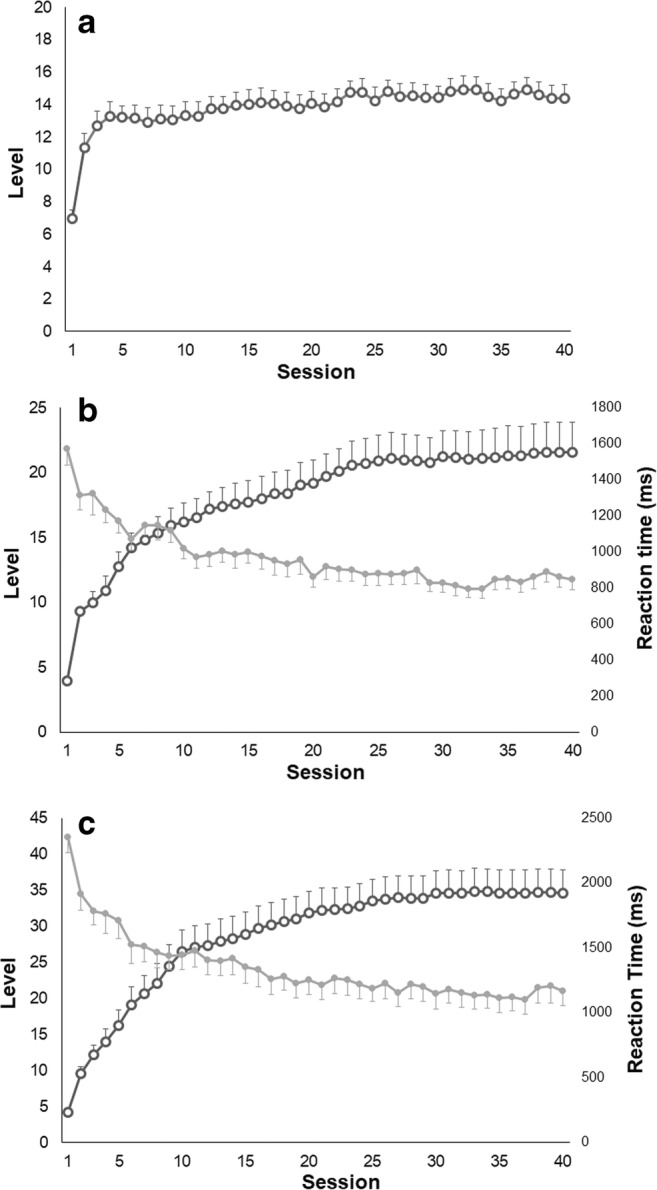
Fig. 1.

Data showing the mean performance of subjects during the cognitive training: a mean difficulty level reached in each session in the visuospatial WM task; b mean difficulty level and reaction time of each session in the “operation” N-back task; c mean difficulty level and reaction time of each session in the “dual” N-back task. Error bars represent standard errors
