Fig. 2.

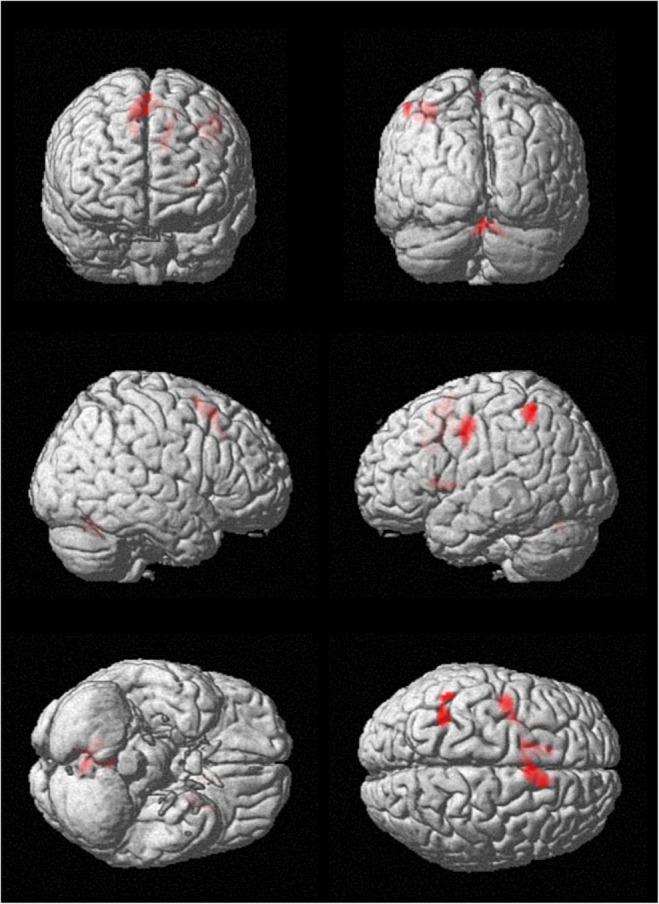
Group activation map of healthy subjects during the PVSAT (see Table 2 for details). Significant blobs are displayed on a rendering surface (height threshold p < 0.05 FWE-corrected; extent threshold k = 30 voxels)

Group activation map of healthy subjects during the PVSAT (see Table 2 for details). Significant blobs are displayed on a rendering surface (height threshold p < 0.05 FWE-corrected; extent threshold k = 30 voxels)